By the Numbers: The Underrepresentation of Women in Photography
According to a new report, despite making up nearly half of the photography workforce, women are dramatically underpaid and underrepresented compared to their male counterparts.

According to a new report, despite making up nearly half of the photography workforce, women are dramatically underpaid and underrepresented compared to their male counterparts.
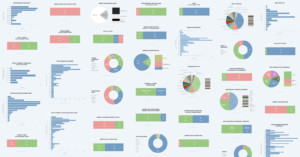
What are famous photographers doing right on their websites? Or better yet, what are they doing awfully wrong despite being successful? In this detailed research report, I thoroughly reviewed over 100 individual websites (from the most well-known photographers out there) to try to uncover all of that.
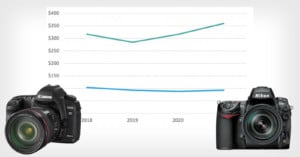
Canon and Nikon have ruled the DSLR landscape for a couple of decades now, but which one has proven more valuable in the long run? Let’s set the scene and then crunch some numbers.

British electronics retailer Currys has published a comprehensive breakdown of insights it collected on the state of photography in 2020 using various statistical methods and sought input from three experts to forecast the troubled photography industry going forward.
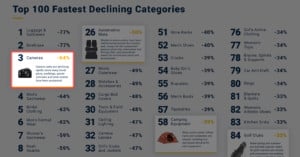
As the coronavirus pandemic brings the world economy to its knees, retail intelligence firm Stackline put together a report identifying the 100 fastest growing and 100 fastest declining industries based on e-commerce data from March. No surprise, the outlook is especially grim for cameras.

Photographer Jason Webber recently embarked on a little statistical experiment. He wanted to see if he could use stats from his Instagram photos to choose the 'perfect' lens purchase by identifying the focal lengths he uses most often, the holes in his lens lineup, and what features he needs to prioritize.
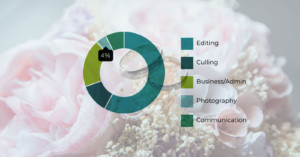
UK company Your Perfect Wedding Photographer—a website that vets and connects wedding photographers with interested couples—has released the results of their fourth annual photographer survey, and it contains some interesting info about how much photographers are making, the brands they're using, how they spend their work time, and much more.
My name is Stefan, and I'm the CTO of the marketing firm Relatable. To facilitate execution of global, large-scale influencer marketing campaigns, we rely a lot on data to give us insights. Using a sample of about 2 million Instagram accounts (with a minimum of 1,000 followers) and 40 million posts, I’ve been digging deep, compiling statistics, finding insights, and just discovering some quirky facts. In this article, I'll share some of my findings.
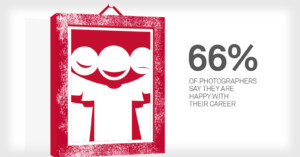
We now know which cameras top photojournalists around the world are using these days, but what are they saying about the state of their industry? A newly published study uses responses from nearly 2,000 photographers to reveal the current condition of the photojournalism landscape.

The issue of businesses asking photographers to work for free has been a hot issue in recent years, and now we have some citable statistics that shed more light on it. According to a new study in the UK, 87% of photographers were asked to work for free in 2016, and 16% said yes.
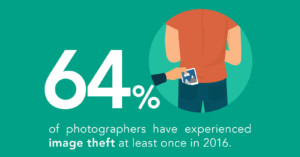
The folks over at the image tracking service Pixsy have released an infographic about the state of photo theft in 2016. As 64% of you have personally experienced, photo theft remains a serious and widespread problem in our digital age.
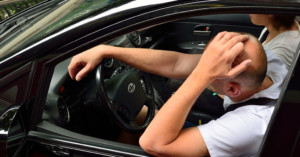
The last time you had or saw road rage, did you post to Instagram about it? If you did, you might have ended up a statistic in a recent report on road rage released by The Auto Insurance Center.
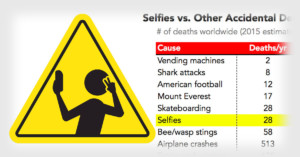
Back in September 2015, we reported that selfies now cause more deaths worldwide than shark attacks. As people become more and more daring in their attempt to snap the perfect self-portrait to share online, there are more stories of those picture-takers getting seriously injured or killed.
Here's a closer look at the numbers behind this disturbing trend.
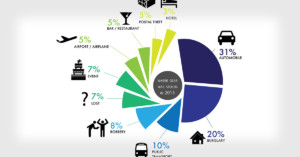
The anti-theft gear registry LensTag just provided us with this new look at how camera gear was stolen over the past year. As you can see from the pie chart above, car and home break ins are still the biggest way thieves are targeting cameras and lenses: they accounted for over half of all thefts reported to LensTag in 2015.
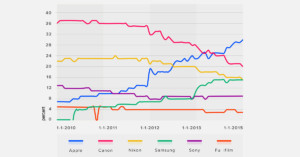
Flickr recently gathered up photo and camera data to review the past year, and now the company is doing some number crunching to reveal major trends in the cameras used by the photographer community.
The graph above shows how the popularity of major camera brands have changed over the past half decade.
Camera sales haven't been doing too well in recent years, but that hasn't kept picture taking from exploding. While the dedicated camera industry has seen year-on-year declines, smartphone photography has turned everyone into a casual photographer: there are now 8 times as many picture takers worldwide than there were 10 years ago.

France's Ministry of Culture and Communication has published a new report on the state of the photography industry in the country. The study contains numbers that offer an idea of how professional photography has changed over recent years.
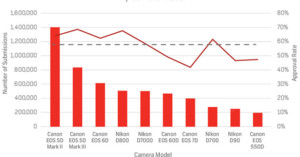
What are the most common cameras used by stock photographers? While we don't have the data across all stock services, Shutterstock has provided us with some numbers that may be somewhat representative for the industry.
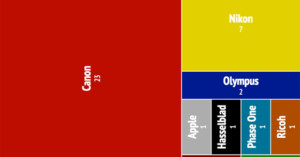
The prestigious World Press Photo contest announced the winning photos of 2014 last week. In case you were curious, here's a look at the cameras that were used to capture the winning photographs.
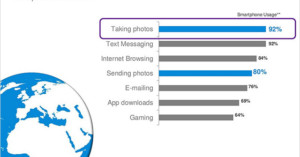
When new smartphones are announced these days, the camera quality and specs are usually front and center. If you're wondering why manufacturers focus so much on mobile photography, check out the chart above: taking photos is the most used feature of smartphones alongside text messaging.
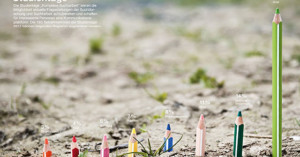
German photographer Marion Luttenberger was asked by Moodley Brand Identity to shoot a series of infographics for Caritas Kontakladen, an Austrian organization that assists drug addicts. The resulting images convey facts and figure in clever ways through carefully arranged physical objects in the frame.
What are the most popular cameras used in the Flickr community? Now that 2014 is in the past, the photo sharing service has done some serious crunching on EXIF data to figure out which cameras were the most popular among its users over the course of the year. Here's a look into the findings.
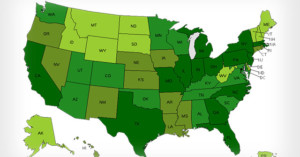
What is the current state of the professional photography industry in the United States? Back in April 2014, the Bureau of Labor Statistics released statistics about the photography profession from May 2013. The data offers an interesting look into where photographers are living and how much they're earning.

You carry a camera everywhere because you just never know when something or someone worthy of having its picture taken will appear. You also work plenty of weddings and events, or you may be a photo journalist for a newspaper. You are a photographer, and are always on the lookout for beauty. But what makes a city good for a working photographer? While it’s important that there are plenty things to photograph, these statistics are equally relevant as well.

While the photography world continues to have mixed feelings on Adobe Creative Cloud and its accompanying subscription model, Adobe execs aren't regretting the move one bit. That's because, according to Adobe's first quarter financial report, Creative Cloud has been a hit.
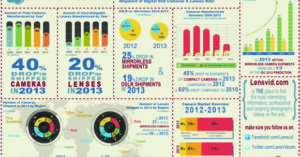
Although there was plenty to be happy about for us photographers last year, 2013 was statistically a very bad year when it comes to camera sales. And now, thanks to an infographic and accompanying video put together by LensVid, we get to look back and find out exactly why that is.
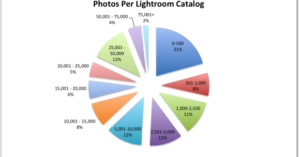
Here at PetaPixel we enjoy the crunching of numbers. So, naturally, when Mosaic told us about a blog post they had done recently that broke down some Lightroom catalog statistics, we were intrigued.
With "tens of thousands" of Lightroom catalogs synched to their service, they sampled a random 3,000 of those to come up with the average size of a Lightroom catalog. And in the end, they were actually quite surprised by the results.
Living smack in the middle of the information age, we're well acquainted with the incredible amount of data and statistics gathered and thrown around on a daily basis. And with the advent of social networking, the amount of publicly available data about society has only increased.
These networks are a treasure trove of information for better understanding the underlying trends and habits of people. Trends that would otherwise go unseen. One research project in particular, called Phototrails, is trying to spot these trends by gathering insights from that photography-oriented social media site many of us love to hate: Instagram.
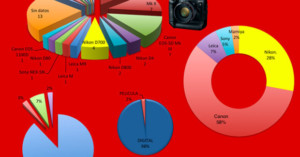
Each year, the breakdown of gear usage statistics by some of the largest news agencies and associations makes itself public; and this year is no exception, thanks to this infographic provided by hastalosmegapixeles.
Looking through the infographic, we get a great look at what gear the press photography pros prefer when they're out in the field shooting World Press Photo award-winners.

First things first: Happy New Year! Whether you're in Berkeley, CA, Bucharest, Romania or Shanghai, China, it's now 2014 for everyone, and we want to start off the new year by thanking you all for a phenomenal 2013. You guys and gals are the reason we get up in the morning and stay up nights wracking our brains to figure out how we can make this site the best photo blog in the world.