Insurance Company Uses Instagram to Determine Trends in Road Rage
The last time you had or saw road rage, did you post to Instagram about it? If you did, you might have ended up a statistic in a recent report on road rage released by The Auto Insurance Center.
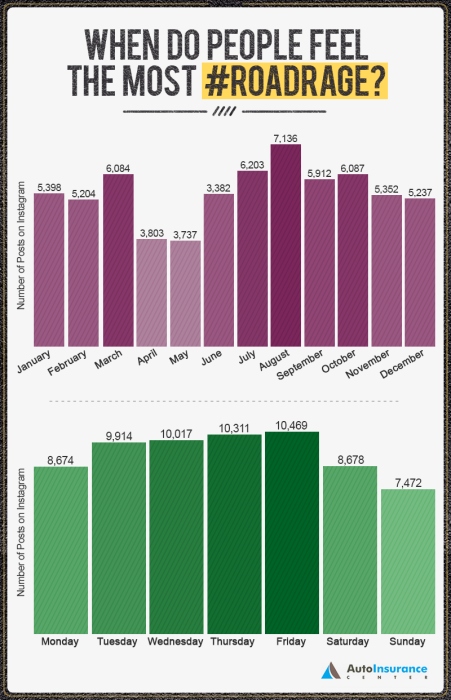
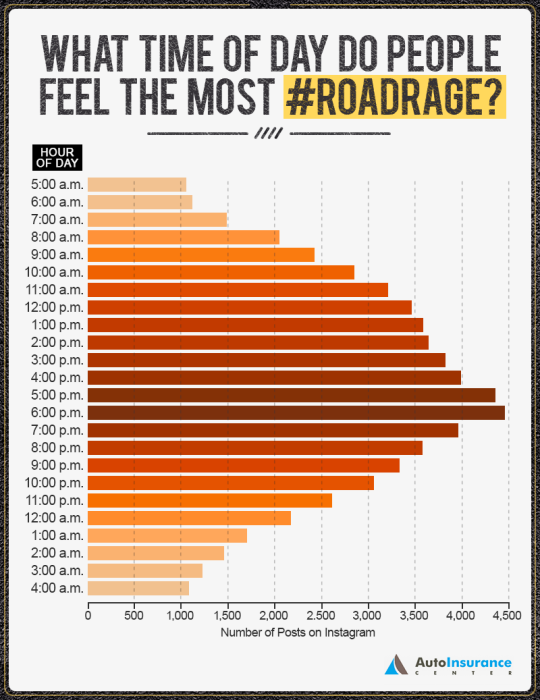
What they found isn’t all that surprising. The most #roadrage filled day of the week? Friday. The most #roadrage filled month of the year? August, with July coming in a close second, probably something to do with summer vacation. Worst time of day? Rush hour.
Oh, and the most #roadrage filled cities? LA came in first, New York City second, and Mount Pleasant, NC third. Although you might be surprised to find out that Hawaii is, far and away, the state with the most #roadrage posts.
To see all the Instagram data for yourself click here. And the next time you see roar rage or feel like you’re gonna lose it, consider logging onto Instagram instead… you know… for science.