infographic

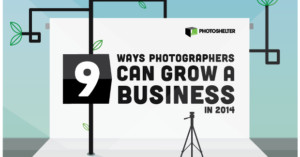
Infographic Gives You Nine Ways to Grow Your Photography Business in 2014

If 2014 is finally the year you plan to turn your love of photography into a business and see if you can quit your day job to do something you enjoy, then PhotoShelter is here to help. In the infographic below, they provide you with nine very useful tips that will help you begin to look at photography from the business side of things.

How They Sent Photos Across the Ocean Back in 1926

These days, it's easy to take for granted what the magic of the Internet, wireless technology, and fiber optic cables have made possible, but there was a time when sending a photograph a long distance in a short time wasn't quite that easy.

For instance, in 1926, someone on an oceanliner called the S.S. President Roosevelt snapped the above photo of the S.S. Antinoe during a rescue attempt. When that photo was sent almost instantly from London to New York City, it was such a big deal that the April 1926 issue of Science and Invention printed a huge infographic to show its readers how this miracle was achieved.

Infographic Maps Out the Landscape of the Photography Industry

The company LUMA Partners has gotten in the habit of occasionally mapping out various industry landscapes to show how a product or service gets from Point A (i.e. the creators, marketers, businesses, etc.) to Point Z (i.e. the buyers, brands and publishers), going through the rest of the alphabet in between.

Taking a leaf out of their book, director of kbs+ Ventures, Taylor Davidson, decided to borrow their format and do the same thing for the photography industry, mapping out how content gets from the photographers out into the world of consumers, brands and buyers.

A Flowchart For Figuring Out Which CC License You Should Use

Creative Commons is a non-profit organization founded in 2001 that, over the years, has released a set of licenses that enable creative types to share their work with others. The content creator allows others to use their work, just as long as the users follow the guidelines set forth in that particular license. It's a "some rights reserved" system rather than an "all rights reserved system."

In the photographic community, some aren't fond of CC licensing while others are downright prolific about it. But if you're looking to license some of your content in this way, this useful infographic put together by CC Australia will help you navigate the common licensing combinations.

An Infographic on Creating Sustainability in the Photography Industry

Photographers often grumble about the rise of hobbyist photographers who charge little to no money across all kinds of photographic niches, robbing hard working professionals of clients and flooding the market with subpar results.

Instead of simply being discontent about how the industry has been changing, photographers Geoff Johnson and Kameron Bayne decided to do something about it. They've created Fotoseeds, a business that aims to make professional photography a sustainable profession by educating photographers, helping them grow their businesses, and doing away with insecurity and ignorance.

What Your Choice of Instagram Filter Says About Your Personality

100 million users are uploading 40 million photographs on a daily basis to Instagram. Of these images, 43% of them dont have any retro filters applied to them. That leaves 22.8 million filtered photos hitting the social network every 24 hours.

Marketing firm Marketo recently poked around with some of Instagram's statistics, and then decided to assign personality profiles to some of the service's most popular filters. It's like Instagram meets Chinese Zodiac.

Flickr Tag Maps Reveal the Most Popular Photo Subjects Across Cities

What are the most popular photo subjects in each location of your city? Is there any easy way of finding out? Those are questions UC Berkeley researcher Alexander Dunkel is trying to answer, and he has his sights set on Flickr as a possible solution. By combining the location geotags and context tags attached to many (or most) of the service's photos, Dunkel is able to create tag cloud-style maps of any location that reveals the tags that dominate each location.

A Graphical Comparison of Mirrorless Camera Sensors Sizes

Mirrorless cameras feature sensors larger than compact cameras and bodies smaller than DSLRs, but how do their sensor sizes compare with one another? To give you a better idea of how formats such as Nikon CX and Olympus/Panasonic Four Thirds stack up against each other, Digital Camera Database created this helpful graphic showing the relative sizes of each format.

Infographic: How Women Feel About Being in Photos

Photo printing company PhotoBox recently conducted a survey of 1,000 women aged 18-65 to find out how they feel about being in photographs. An interesting finding was that the women generally cared much more about how other women view the images than how men view them. Only 10% of women care about what men think of their photogenic-ness. Of the other 9 in 10 women, it's the 36-45 demographic that cares the most about being judged by other women.

A Facebook Timeline Showing the History of the Photograph

If the photograph was a living person, what would his Facebook timeline look like? Photo aggregation service Pixable decided to answer this question, creating a giant infographic on the history of the photograph with the layout of a Facebook timeline. It all starts at the very bottom of the timeline, with the photograph's birth at around 1000 AD. Over the years, we see the marriage he has with Kodak, the Kodachrome process born to the couple a few decades later, and a subsequent relationship she has with Digital Camera.

A Snapshot of the Photography Industry

Did you know that more photos are created every two minutes than in the entire 1800s? HighTable created this infographic that gives a quick overview of the state of the photography industry and the rise of mobile photography.

How to Recreate the Look of Instagram Filters with Vintage Cameras and Films

Instagram's filters are meant to mimic the look of vintage and toy cameras, but have you ever wondered which cameras and films you'd need to make analog photos with the same look? The folks over at 1000memories decided to tackle this question and, after a good amount of research, came up with a neat infographic showing the different camera and film combinations you can use to recreate popular Instagram filters.

Generate an Infographic Showing Your iPhone Photo Habits

Photo Stats is a new iPhone app that can help you visualize your iPhoneography habits by automatically generating interesting infographics showing things such as where you snapped photos and the time of day you shoot the most. You can buy it for $1 in the App Store.

Canon vs. Nikon: Comparing the Two Heavyweights Camera Makers

Dutch consumer product website Beste Product ("best product") decided to set up a royal rumble between the two heavyweights of the camera industry: Canon and Nikon. They created an infographic comparing the two companies in things such as expert and user opinions, popularity, and sales. Even if you're sick and tired of the endless comparisons and debates (as you should be), the infographic provides some interesting facts about how the two companies are doing.