Geotaggers’ World Atlas: Photo Spots Reveal the Most Interesting Places on Earth
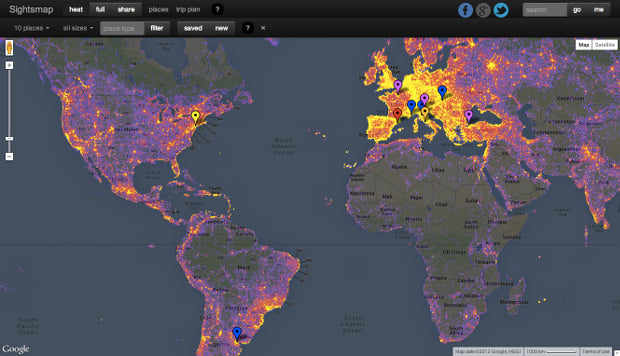
It was five years ago that we first covered Eric Fischer’s Geotaggers’ World Atlas project. His goal was to gain insight into the world’s most interesting places and routes by gathering vast amounts of geotag data from Flickr photos.
Since that time, technology has allowed Fischer to turn the map into an interactive experience. This week, he launched a fully interactive map of the Geotaggers’ World Atlas that includes every city on Earth. You can now browse to any location you wish to see how photos are captured in that location.
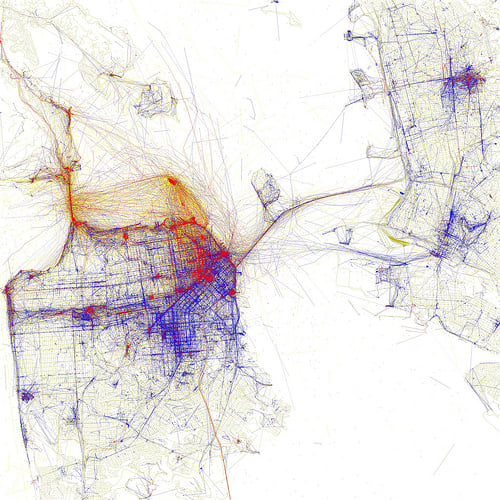
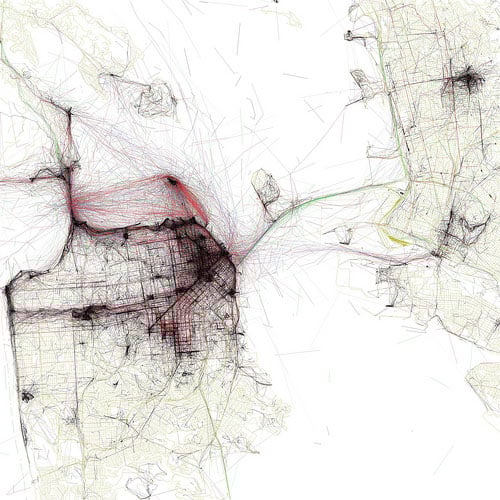
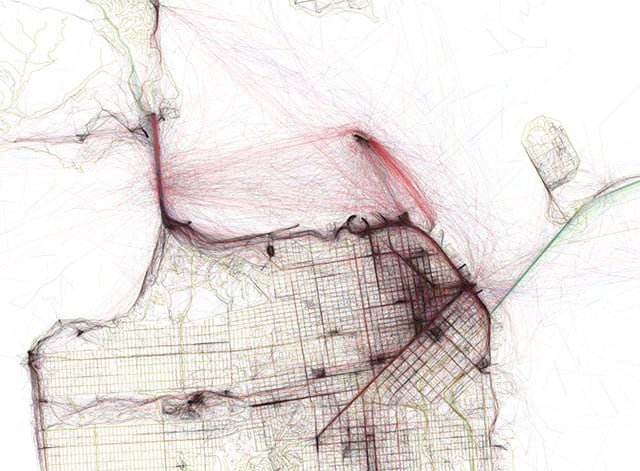
When you zoom all the way in, you’ll see that the 10 years worth of data is visualized in large numbers of colored lines.

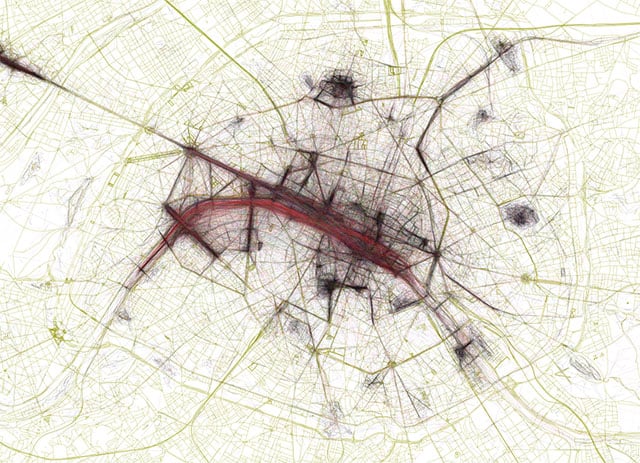
The lines indicate the paths between subsequent photos taken by the same photographer, and the colors indicate speed. For example, red lines show paths on which photographers traveled at between 7 and 19 miles per hour (based on timestamps).
Here’s what the data looks like for some major cities around the world.
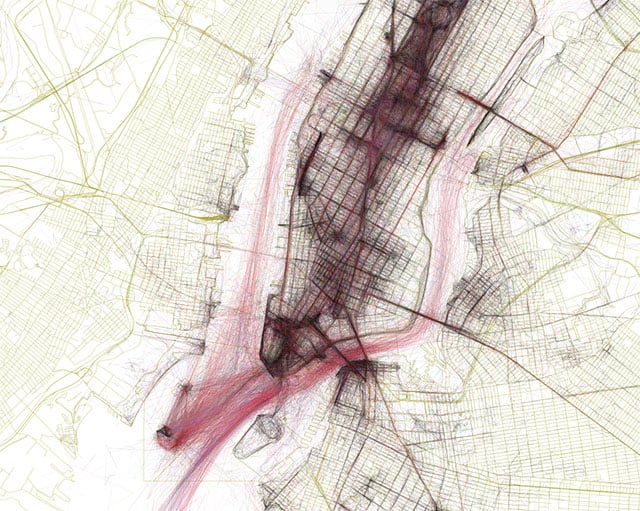
New York City
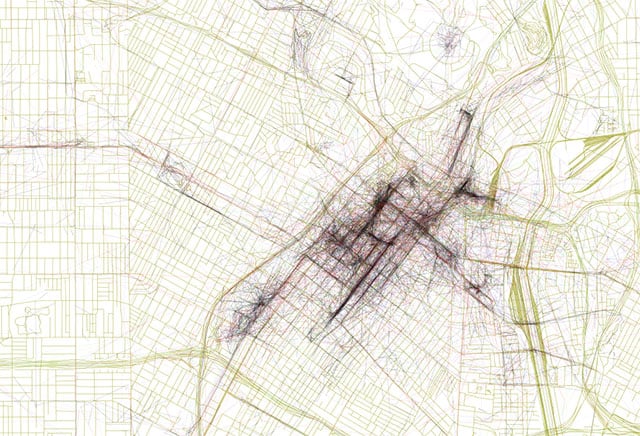
Los Angeles
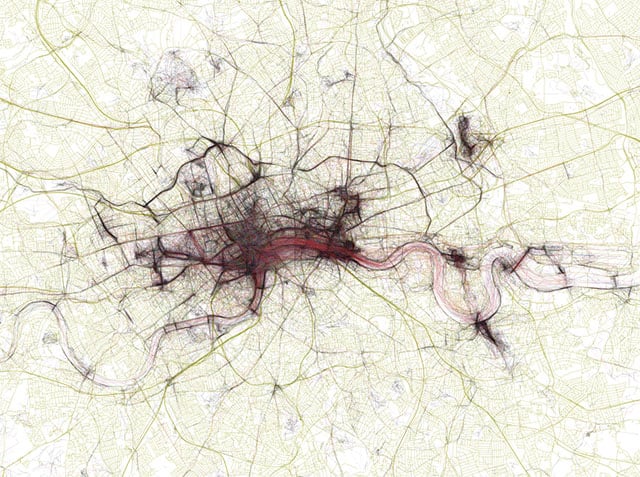
London
Paris
Want to explore your own city? Here’s the interactive map:
Geotaggers’ World Atlas [Mapbox]