Satellite Photos Show How Deadly Myanmar Earthquake Transformed the Earth’s Surface
One month ago, a powerful and deadly magnitude 7.7 earthquake hit central Myanmar, devastating the southeast Asian country and killing at least 5,400 people. Scientists are investigating the geological impacts of the tragedy using satellites, discovering that the earthquake transformed the Earth itself in Myanmar.
Myanmar is still recovering from the devastation, with over 500 people still missing. Recovery and rescue efforts are heavily hampered by the ongoing civil war in Myanmar that started in 2021. The March 28, 2025, earthquake was the most powerful to hit the country in over a century. It also affected Thailand, killing approximately 70 people, and was felt in parts of southwestern China and Vietnam.
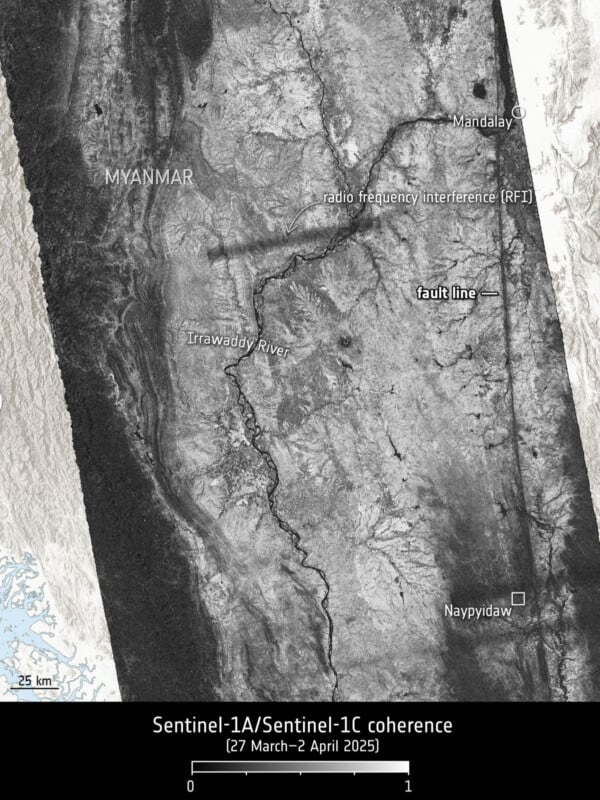
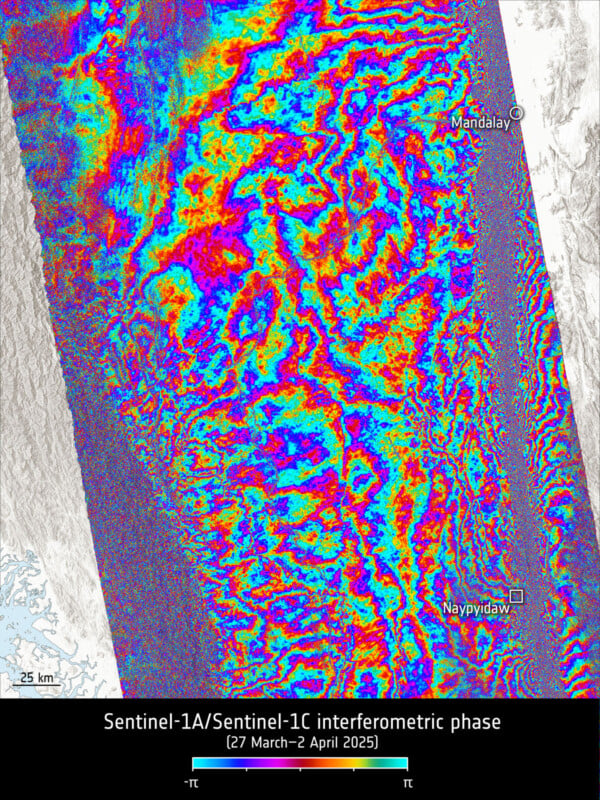
As Space reports, the European Space Agency (ESA) has numerous satellites in orbit around Earth that are constantly monitoring the Earth’s surface, including the Sentinel-1A satellite. As part of its routine orbital path, the satellite captured a radar image of Myanmar just one day before the earthquake. A few days following the earthquake, ESA’s Sentinel-1C revisited the location to acquire fresh images to measure the damage surrounding the Sagaing Fault.
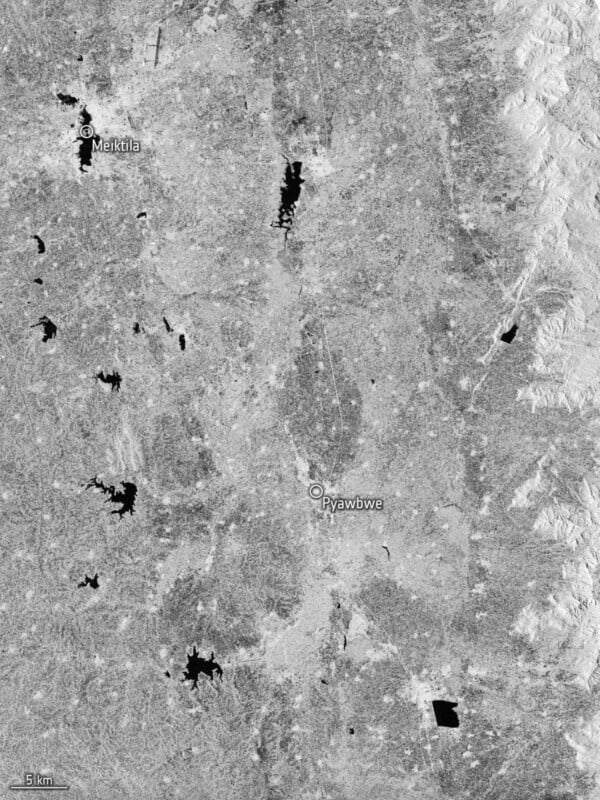
The 870-mile-long Sagaing Fault typically shifts about 18 to 20 millimeters (0.7 to 0.8 inches) annually. Thanks to the incredible precision of the Sentinel satellites, which can detect changes in the Earth’s surface with millimeter precision, scientists detected tectonic slip in the range of a staggering 160 centimeters, or about 5.2 feet. That is massive displacement.

While the immediate priority, as the ESA explains, is to support recovery efforts in Myanmar, the detailed satellite data provides valuable insights into not only broader earthquake science but can identify areas at greater risk of further seismic activity in Myanmar.
“This information is vital for improving earthquake models and for developing effective disaster response strategies, including guiding safe and informed reconstruction, helping communities rebuild with greater resilience,” the European Space Agency says.
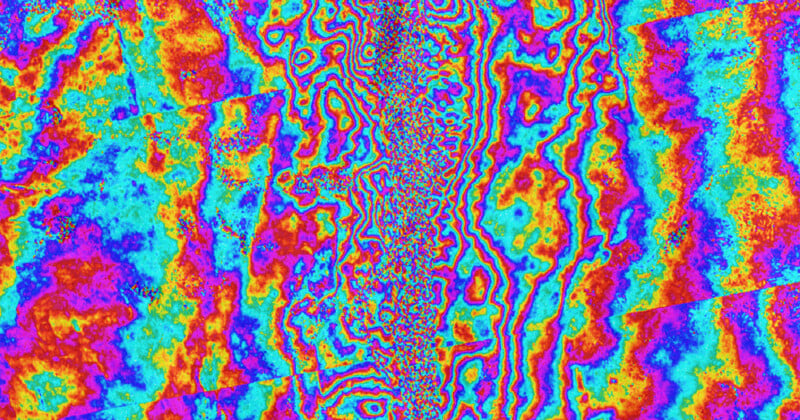
The Sentinel-1 mission captures detailed photos of the Earth’s surface using complex data acquisition and processing techniques called “synthetic aperture radar interferometry.”
As ESA explains, “This involves combining two radar images, one from just before and one from just after the quake to produce an interferogram. By using tiny differences in the radar signal phase to detect ground shifts with incredible precision, the result is a colorful fringed pattern that reveals how the land moved during the earthquake.”
The Sentinel-1 satellites also feature an advanced radar imaging mode called “Terrain Observation with Progressive Scans.” This unique ability enables scientists to measure ground motion in east-west and north-south directions, rather than just one direction along the flight path. This enables the satellites to provide a complete view of ground deformation.
“We’re thrilled with the clarity of the results,” says the team from the DLR German Aerospace Center’s Microwave and Radar Institute. This team processed and analyzed the satellite data.
“These data are a game-changer,” adds ESA’s Sentinel-1 System Manager, Dirk Geudtner. “They enable faster, more accurate assessments after disasters, and helps us to improve earthquake models globally. This is a textbook example of how space technology helps us understand seismic hazards.”
While the images are beautiful and interesting to look at, it is essential to remember that what they reflect is damage from a deadly natural disaster that extinguished many lives. Hopefully, images like this will help scientists better understand earthquakes, identify risks, and ultimately save lives.
Image credits: Images include modified Copernicus Sentinel data (2025), processed by DLR Microwave & Radar Institute/ESA