This is What the History of Camera Sales Looks Like with Smartphones Included
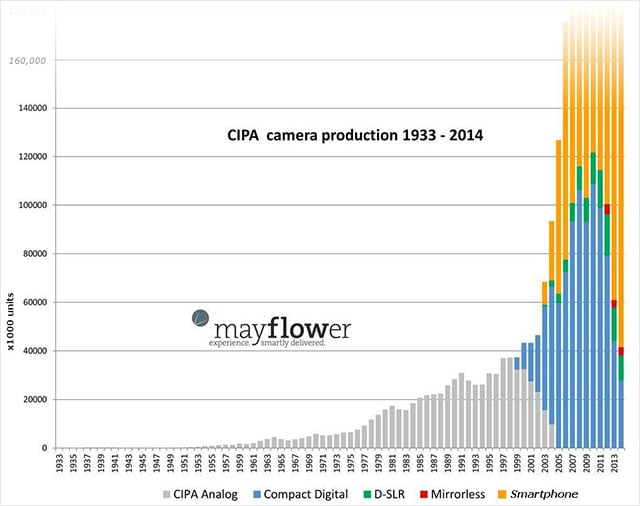
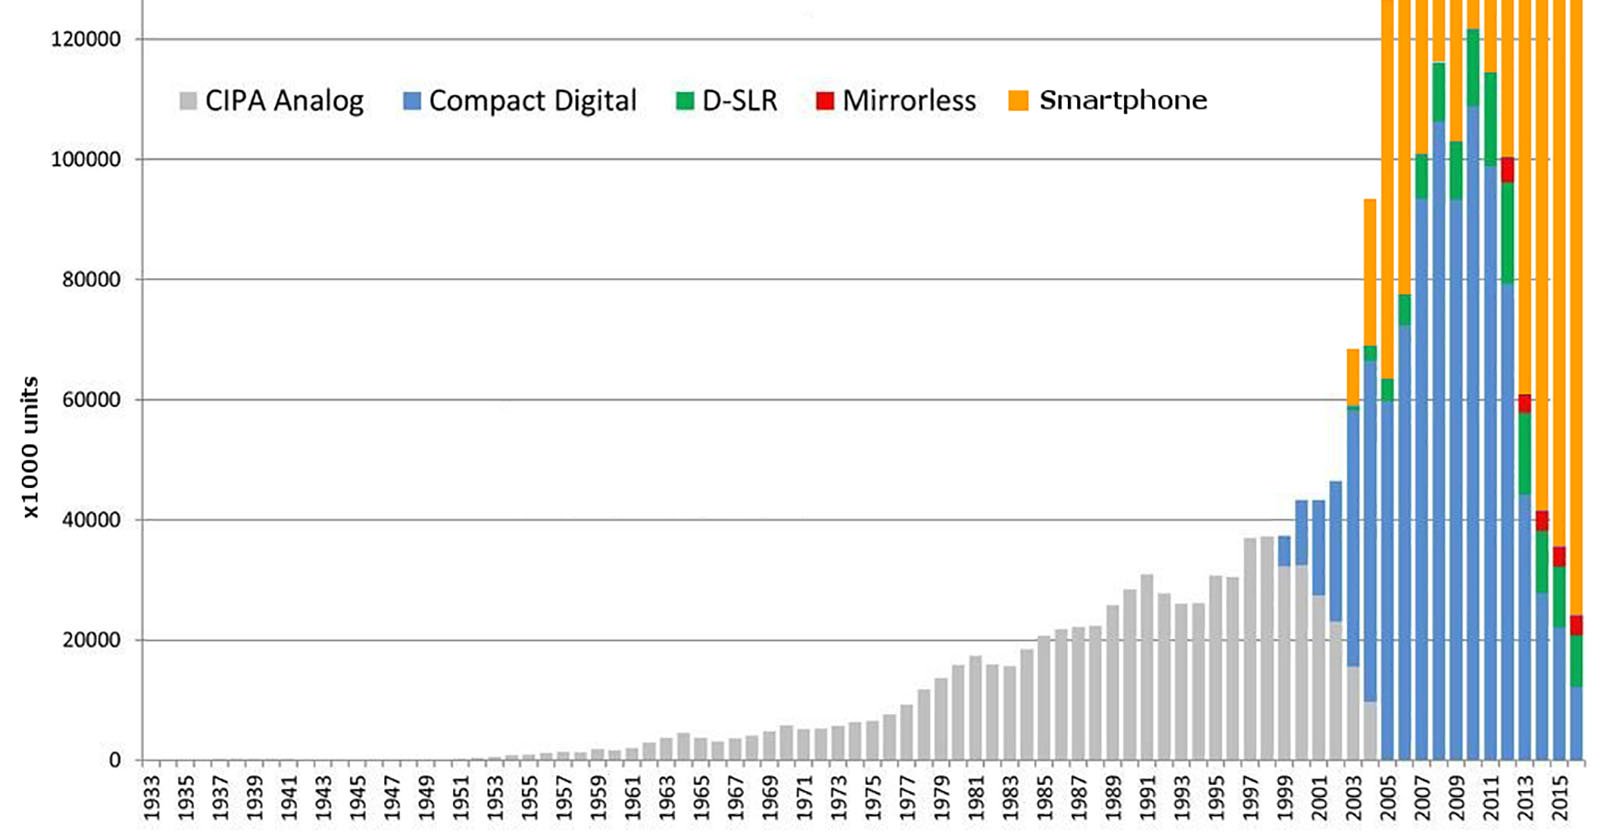
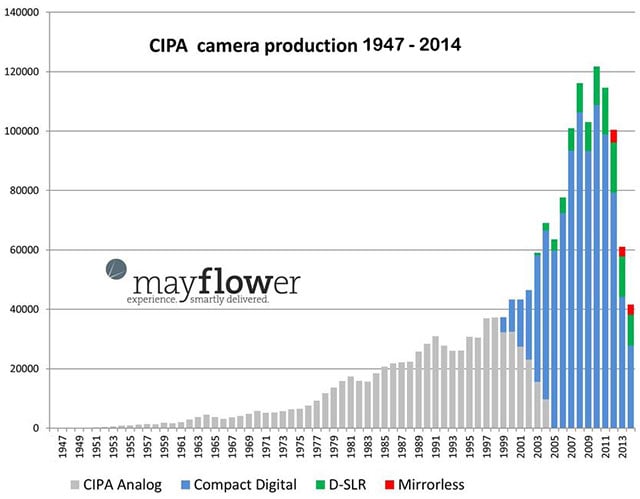
A few months ago, we shared a chart showing how sales the camera market have changed between 1947 and 2014. The data shows that after a large spike in the late 2000s, the sales of dedicated cameras have been shrinking by double digit figures each of the following years. Mix in data for smartphone sales, and the chart can shed some more light on the state of the industry.
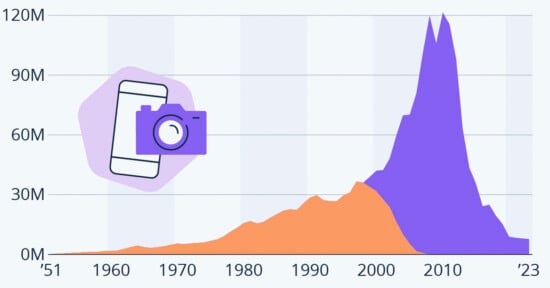
Photographer Sven Skafisk decided to see what the same chart would look like with smartphone sales factored in. Here’s the chart he came up with using data from Gartner Inc. (The figures don’t include the sales of PDAs and “dumbphones”):
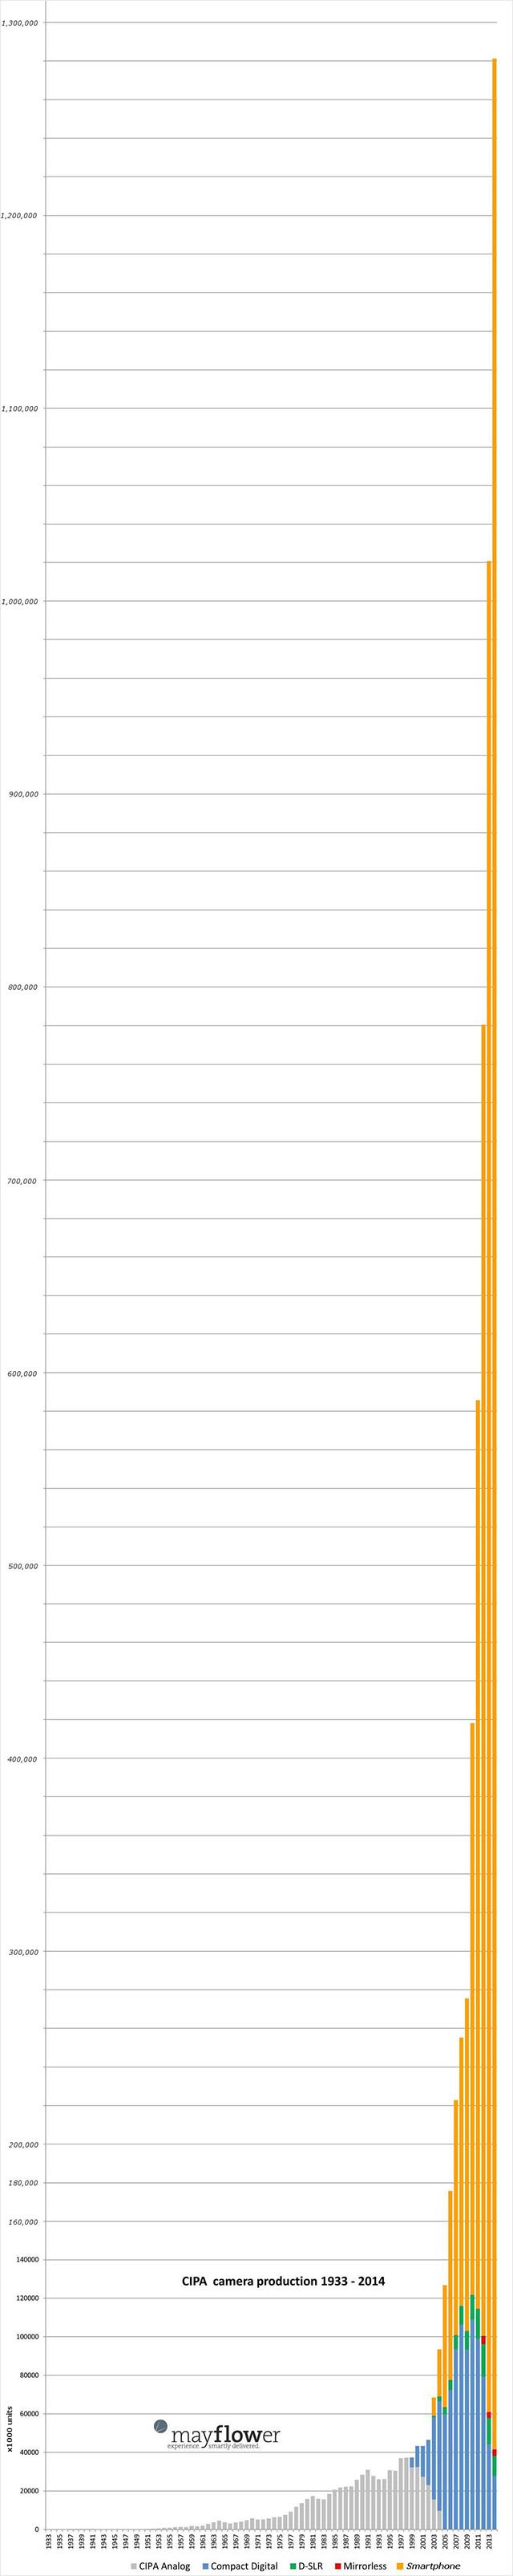
“I would argue that the camera industry is healthier than it’s ever been… but the brands we all think of as ‘the camera companies’ aren’t participating,” Skafisk says.
Smartphone cameras have improved quite a bit in the past several years, and smartphone sales have also been skyrocketing. Correlation between growing smartphone usage and declining camera sales doesn’t imply causation, of course, but still, these sales comparisons are interesting to see.
P.S. Here are a couple of additional facts: the number of photos captured each year has also been growing exponentially since the beginning of photography — digital took over film’s volume over the past decade or two — and 92% of smartphone users worldwide say that the camera is the most used feature on their phones.