This Chart Shows How the Camera Market Has Changed Over the Past Decades
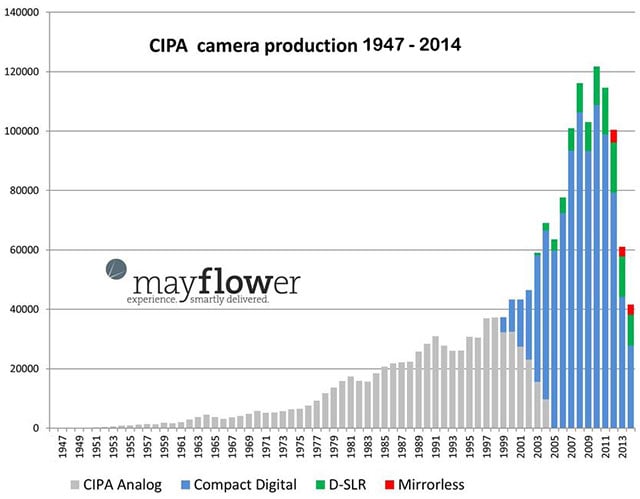
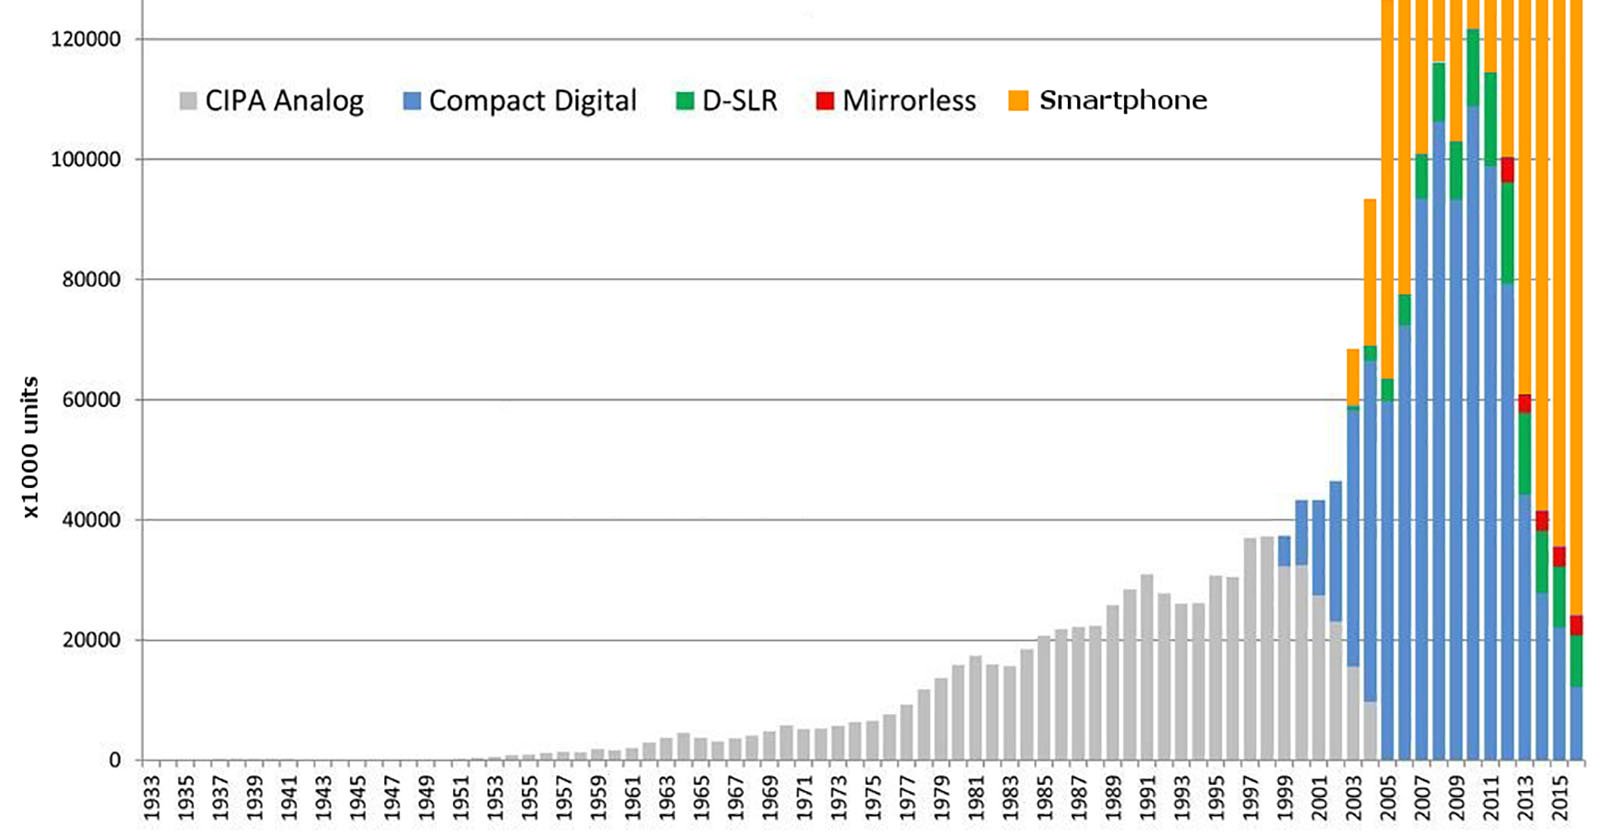
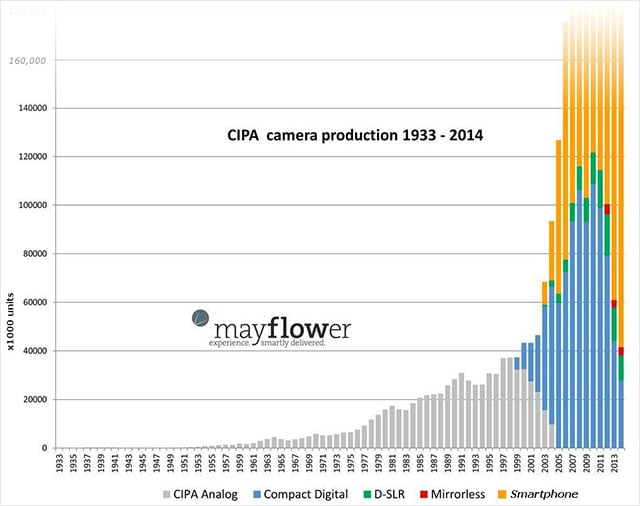
How have camera sales changed over the past 60 or 70 years? The chart above offers an interesting look at this question. It shows camera production between 1947 and 2014.
The biggest victim of the changing landscape has been compact cameras, which are becoming redundant as smartphone camera quality continues to improve — but it is unclear how much of this drop can directly be attributed to the rise of the smartphone camera.
DSLR and mirrorless cameras haven’t been affected as much, but they’re definitely not helping the overall trend for cameras in general. Total sales are roughly at levels they were a decade ago.
(via Mayflower Concepts via Mirrorless Rumors)
Update: An earlier version of this post attributed the plummet of camera sales in recent years directly to the rise of smartphones. As readers have pointed out, how much of an impact smartphones have had is currently unknown.
Earlier this month, Hilbig gave an interview in which he stated that “there is no correlation between smartphone growth and camera [market] shrinking. You can prove that.” Other reports and studies seem to contradict that statement.
What are your thoughts on this issue? Feel free to weigh in in the comments below. Also, here’s a poll with this question: