How to Read MTF Charts for Camera Lenses
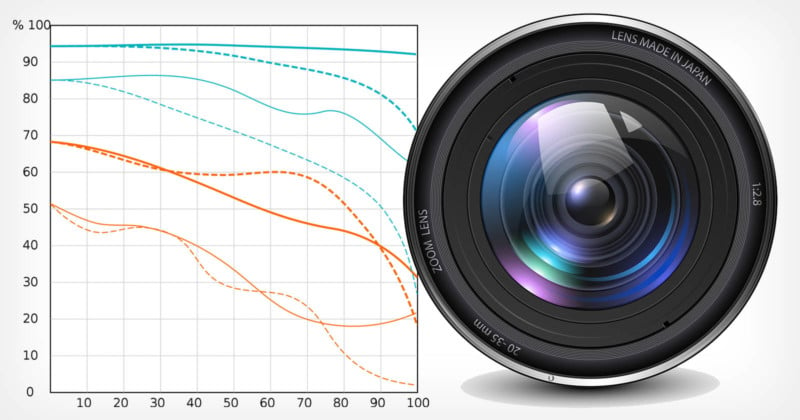
Purchasing a new lens for your kit can be an expensive endeavor and the more information you know before making a purchase is always useful. You may have noticed that lens manufacturer sites tend to include what is known as a Modulation Transfer Function (MTF) chart.
Table of Contents
How MTF Charts Help Photographers
MTF charts give photographers a decent indication of how a lens will perform under certain conditions; they compare real-world lenses with a hypothetical ‘perfect’ lens. Even lenses designed with the highest level of precision have minor imperfections and aberrations that are naturally present in the glass. Learning to read an MTF chart will help you understand how sharp a lens is from its center to the outer edges.

Due to the way lenses are crafted, their sharpness and contrast tend to be strongest in the center of the image and weaken as you move toward the edges. When looking at an MTF chart you will notice that there are two labeled axes. The vertical axis is always marked from 0 to 1 and is read as a percentage. The higher something is charted on the vertical axis, the higher the lens’ performance in that area.
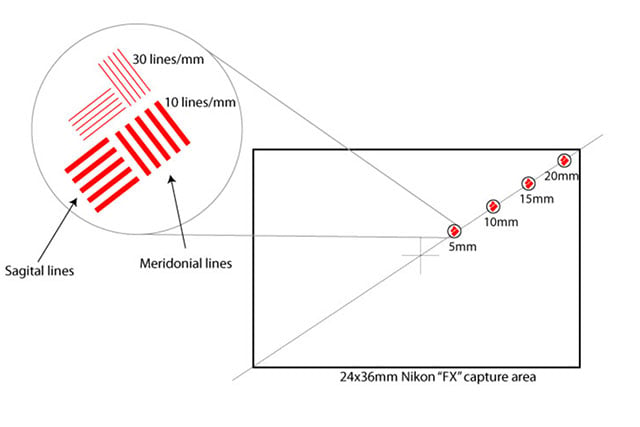
The horizontal axis tells you the distance of the measurement in millimeters from the center of the frame to the edge. On a standard full-frame camera body, the distance from the center to the edge of the sensor is around 21.6mm. When a lens is measured for a smaller sensor type, such as an APS-C sensor, the distance will decrease.
Learning How MTF Charts Measure Performance
Now that we understand that the chart shows how a piece of glass performs from the center of the image to the edge, we can discuss exactly what is being measured and the process that takes place. Some people may not be aware, but sharpness is measured in two different ways. The first is to look at the contrast of a lens and the second is to look at the overall resolution of a lens.

The contrast of a lens is its ability to show a clear distinction between dark and light levels of a subject. If we were to line up a collection of black dashes and take a photograph, the point at which the space between said dashes starts to become grey instead of white is when the lens’ contrast performance decreases.
The resolution of a lens, on the other hand, is the overall ability of a lens to render very fine pieces of detail. A lens can be very high in resolution, but low in contrast, thus displaying a blurred or ‘soft’ image.
According to Canon, “there are a good number of optical engineers who feel that higher contrast will result in a lens that more users will regard as ‘sharp’.” The answer is to find a good balance of contrast and resolution when developing a lens.
How to Read Manufacturer MTF Charts
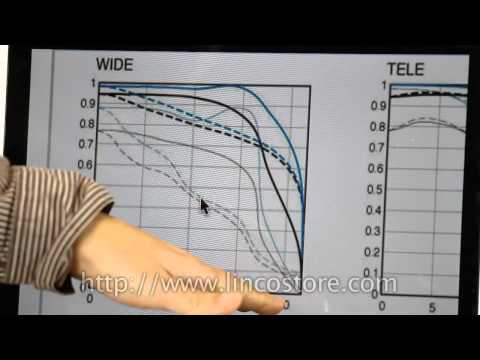
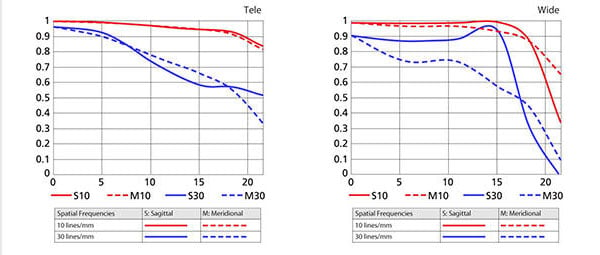
Different manufacturers test their lenses’ performance using slightly different procedures, yet the general idea remains the same. A set of thick black dashed lines (usually around ten lines per millimeter) run from the center of the image to the edge. Similar to our example above, the lines are then analyzed to see when the white space between them begins to turn gray. These results are then plotted on the MTF chart as thick lines.

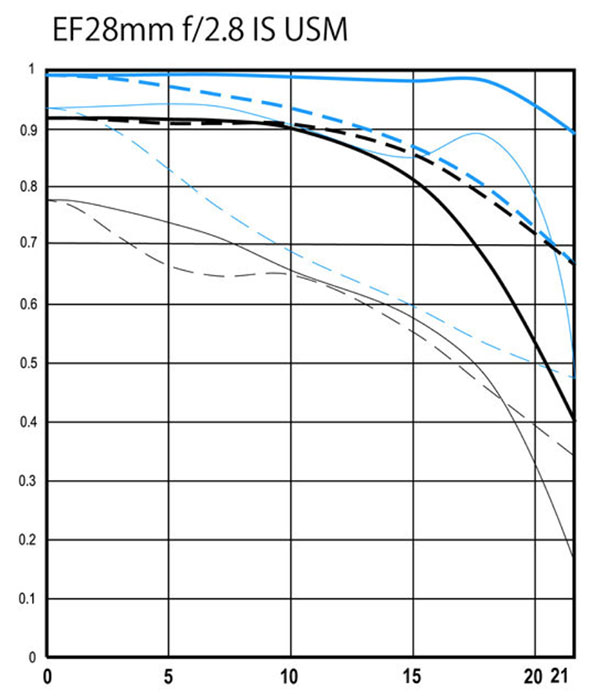
At this point you may be saying, ‘but wait, there are four thick lines!’. Each thick line you see on an MTF chart depicts contrast testing under different conditions. In our example MTF chart, the company tests the lens at its widest aperture (blue) and at f/8 (red). Most manufacturers tend to test once at wide open, then at a ‘middle aperture’.
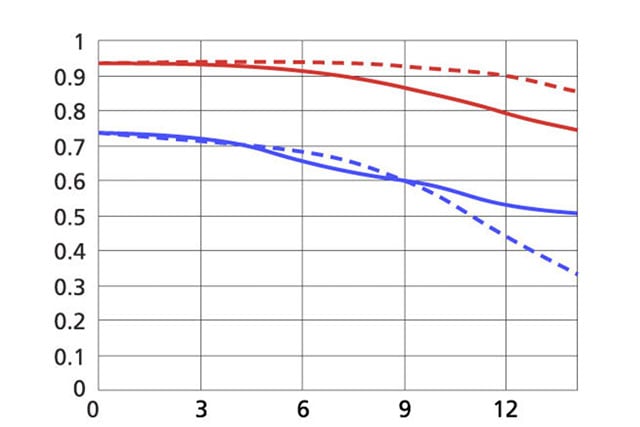
You will also notice that the lens’ contrast measurement at both wide open and f/8 is represented by two lines and not one. For a lens, lines that are running parallel to the diagonal from the sensor are easier for the lens to reproduce accurately. As a result, the tests are run with two different dashed lines: one set that consists of parallel diagonal lines (sagittal) and one that consists of perpendicular lines (meridional).
Putting this information together, we can look at how the lens handles the contrast in two separate aperture configurations with both types of lines. Typically, sagittal lines are represented as solid lines on MTF charts while meridional lines are represented as dashed lines.
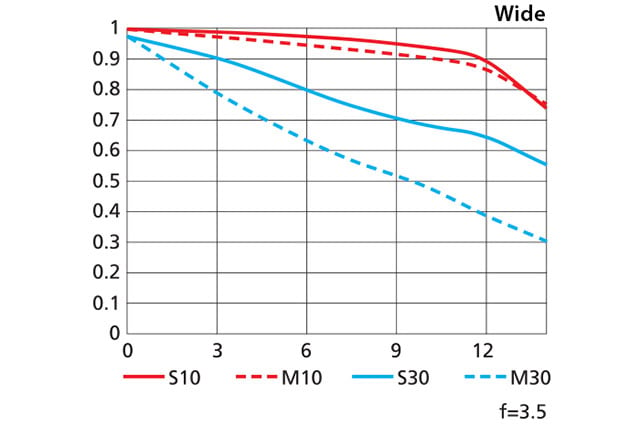
Resolution is tested and charted in a similar way, but instead of having the lens view thick black dashed lines (around 10 lines per millimeter), it views a collection of more closely spaced lines at around 30 lines per millimeter. When seen by the lens, the resolution begins to decrease as it is harder to discern the lines from each other, and they will seem to blur together.
The results from a resolution test are plotted on the MTF chart in the same fashion but are instead represented by thinner lines. Now you can read an MTF chart and tell at what point a lens’ contrast and resolution begin to decrease, and the conditions under which the results were obtained.
The basic key idea to keep in mind when viewing an MTF chart is that the closer to the top of a chart the line is, the better it will perform. Most manufacturers and photographers agree that a rating of above 0.6 is acceptable, while a high-performance lens will score about 0.8.

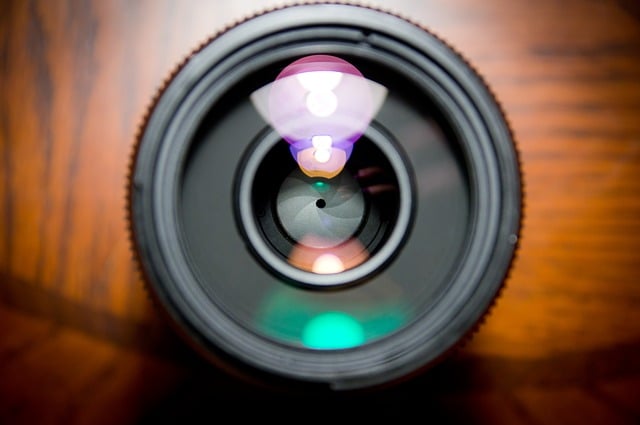
It is also worth noting that you can tell the ‘bokeh’ or quality of blur from reading an MTF chart. Simply look at the distance between the sagittal and meridional lines. A lens that displays more natural-looking bokeh will have the two lines plotted closer together. You can keep this in mind to note how bokeh changes at different apertures.
Some Additional Notes to Think About
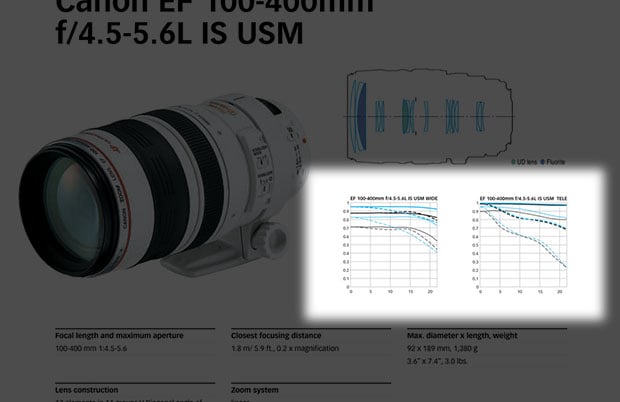
Now that you are ready to go out and begin comparing lenses for their performance, there are a few notes that you have to be aware of during your journey. First, manufacturers may use different methods to measure their lenses’ performance, so comparing MTF charts between different lens manufacturers may not give you an accurate idea of performance. Also, side-by-side comparisons of lenses with different focal lengths will not give you an equal comparison.
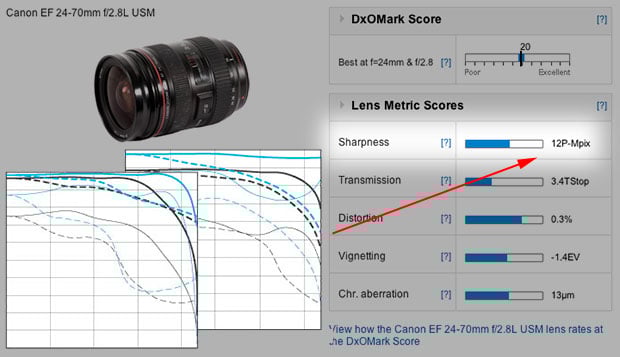
MTF charts are very useful, but they don’t take into account every aspect of a lens. For one, they do not measure a lens’ linear distortion, chromatic aberration, or flare. In addition, lenses are generally tested at one ideal focus distance and not through the entire range. Lastly, remember that each piece of glass can have slight differences during the manufacturing process. Check out the video below for an example of how your lenses are made.
Next time you are on the market for a lens, be sure to compare your two favorite ‘same-brand’ lenses with each other to see which one is rated as having better performance — but remember that not everything can be taken into account. Read up on each lens and view sample photographs to give yourself a better idea of what you are purchasing.
Image credits: Header photo from Depositphotos, header chart by Rheto and licensed under CC BY-SA 3.0.