There Is No Perfect Lens Test, Either
In my last article, I wrote about the fact that every copy of a given lens has some bit of sample variation. This affects lens reviews, whether lab-based or photography-based, because the copy they tested will be just a bit different from the copy you buy. I suggested, that if you want to get a feel for what the lens you purchase is likely to be like, you had best compare several different reviews. That should give you an idea of the variation that exists.
Photographs are really the best way to evaluate a lens’ performance, but you have to look at a few dozen, minimum to do it. That takes a lot of time and a fair amount of bandwidth. Looking at online size jpgs is worthless unless all you do with your images is post online-size jpgs. You need to download at least full-size jpgs (preferably RAW files) and look at them at 50% magnification to get a good idea about a lens’ performance.
Lab testing, with its numbers, gives us nice, quick overviews of lens performance. It’s useful for lens reviews so that you can compare one lens to another. It’s useful for people like me who have to test lenses to make sure the optics are OK, since it eliminates some of the human variability that comes with looking at images of a test chart.
But each type of lab test has its own strengths and weaknesses that nobody ever talks about. This is important if we’re going to compare several different reviews of a lens, because we should have some idea of what the reviewers are actually analyzing. Like every scientific test, if you don’t have a grasp of the testing methods being used, you can’t possibly understand the results.
I’ll give you one teaser before we start. I don’t trust test results for lenses of 24mm or wider (full-frame equivalent). Period. Including most of mine. I’ll get into why in just a bit.
Basically there are two types of lab testing used for reviews: computerized target analysis and optical bench testing.
Computerized Target Analysis
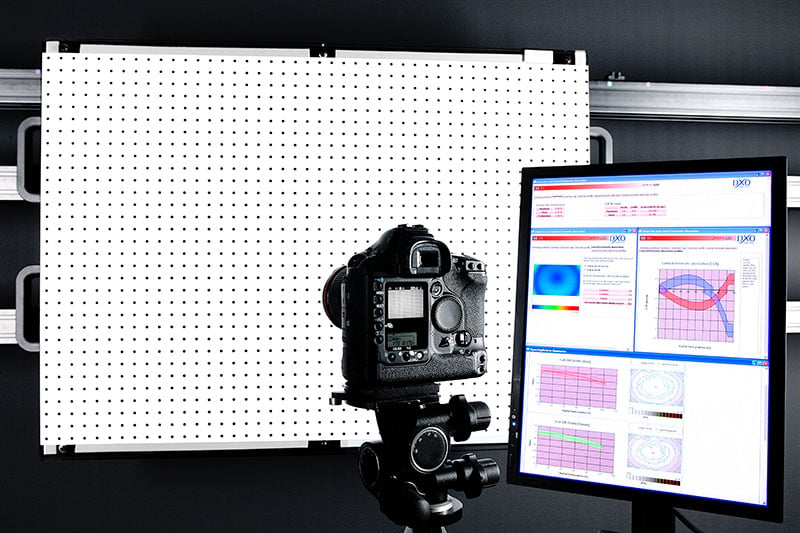
Computerized target analysis, using either Imatest (used by LensRentals, Photozone, Lenstip, and others) or DxO Analytics (used by DPReview, DxOMark, SLRGear), are the most commonly used lab tests. Both programs work by taking carefully aligned and lighted photographs of a specific test chart which are then analyzed by a computer program. The program then analyzes the file and determines things like resolution, distortion, vignetting, etc.
There are differences between the two programs. DxO Analytics is proprietary (and I don’t own it so my comments are secondhand) but it analyzes round dots rather than lines, and results are given in ‘blur units’. What the exact definition of a ‘blur unit’ is remains somewhat debated outside of DxO.
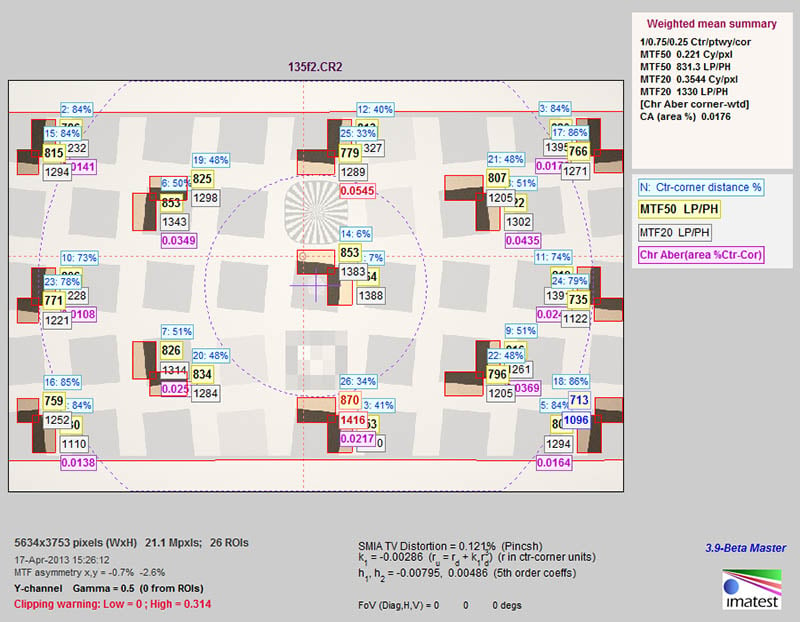
Imatest analyzes slanted lines and other patterns and can be used with a number of different charts (which generate somewhat different results). Resolution is given in line pairs per mm or line pairs per image height at a given MTF; usually MTF50.
![Imatest SFR test chart shown on computer screen [#]](https://petapixel.com/assets/uploads/2013/10/SFRplus_paramsetup.jpg)
There are differences between the two programs, and while we don’t know all of those differences, they should ‘internally agree’ but not necessarily ‘externally agree’. In other words if one person using DxO decides Lens A is sharper than Lens B, all the DxO testers should find the same results. On the other hand, it is possible (although unlikely) that Imatest might find Lens B is sharper than Lens A, but in theory all Imatest users should find the same thing.
In practice, though, Imatesters may not agree nearly as much as DxO testers. Why? Because Imatest’s flexibility allows much more variation. There are several different test charts you can use (and depending on the chart, what is defined as the corner of the image differs a lot). You can analyze RAW files or jpgs (which have some in-camera sharpening applied). Imatest gives vertical and horizontal resolution separately, indicating astigmatism, and the reviewer can average the numbers, use the higher number, or lower number, etc.
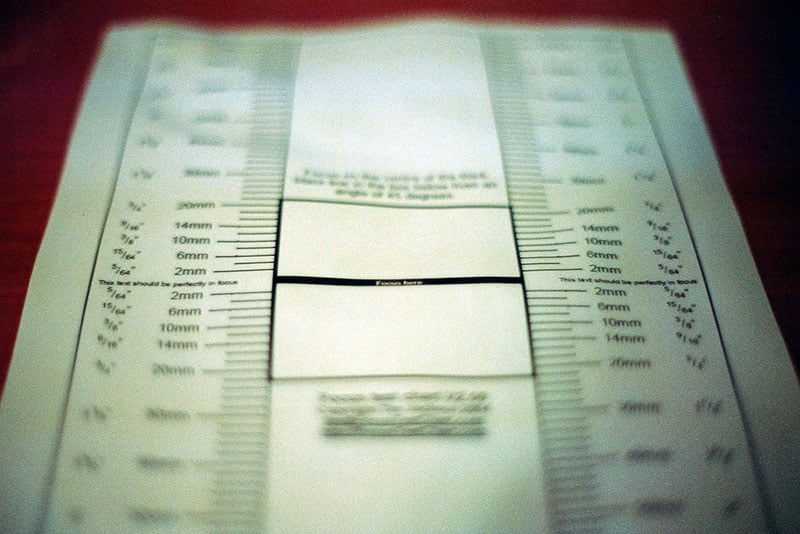
There are a number of other test charts that can be analyzed in Imatest, theses are just the most common examples. This can be a critical difference when looking at lens reviews, by the way. It’s cheap and easy to buy an inkjet printed (or even home print) test chart and shoot Imatest. The reality is unless the chart is a high-quality linotype print (which are quite expensive — $400 to $1,000 each) the chart limits the program’s abilities. With really high resolution cameras, like the Nikon D800, Imatest now recommends using backlit charts printed on film.
Using a lesser chart doesn’t invalidate the results, but it certainly puts a ceiling on them. When some testers find a new, very sharp, very high resolution lens ‘isn’t much better’ than others they’ve tested, I sometimes wonder if they’re nearing the ceiling of their chart’s capabilities.
Disadvantages of Target Analysis
The above stuff is just splitting hairs that show why different testers get slightly different results. There are several real problems with target analysis, though, that affect all testing done with target analysis.
It tests a camera-lens system, not just a lens. That’s generally not a big deal. If you’re interested in Canon cameras you’re probably interested in Canon lenses. But it causes some problems. If you’re looking a a lens that’s been available for several years the reviews may have been done on an older, lower resolution camera. That can make the lens seem worse than it is compared to lenses reviewed on newer, higher resolution cameras. It can also be a problem if you want to buy a third party lens in one mount but can only find reviews of it on another mount.
Focus Distance. At my company LensRentals we’ve got targets ranging in size from 24″ to 85″ in diameter. But that means on the very largest targets we’re testing wide angle lenses very close to the target. For example a 24mm lens is tested at about 6 feet shooting distance. A 14mm we’re shooting at about 3 feet from the chart. Making the assumption that the sharpest lens at 3 feet shooting distance is the sharpest lens at infinity is, well, weak. There have been several examples where target analysis reviews say a wide-angle lens is just great, but in the field, shot at infinity, photographers unanimously say it’s not that great. (And now you know why I don’t really trust these tests on wide-angle lenses.)
The same problem comes up with macro lenses. My first Imatest results showed that the Nikon 105mm f/2.8 Micro just wasn’t that great. But, guess what? Even with my smallest charts I was shooting it at an 8-foot distance. When we developed techniques using high-resolution backlit Imatest targets shot at 1 foot distances more appropriate for a macro lens, it turned out to be a great lens. I ended up writing a blog post saying, yet again, I was wrong less correct than I had hoped to be.
Until we paint test targets on billboards (don’t laugh, I looked into it), we’ll still be testing wide angle lenses at very close distances.
Field Curvature: When I focus on the center of the image in a lens with field curvature (most lenses have a bit), the corners aren’t in best focus. If I change focus a bit, I can get higher numbers for the corners, but drop resolution in the center. Some reviewers use the corner numbers when the center is in best focus (that’s my habit, since I think it reflects real-world photography best). Others think it more appropriate to give you the best possible corner numbers, more like what you’d get if you were focusing off-center. Probably giving both would be the best way to do it, but I’m not sure anyone does that.
Summary of Computerized Target Analysis
When you look at a review using computerized target analysis you should check the testing methods to see exactly how they got those results (and why the results differ).
- What camera was used? Test the same lens on a Nikon D700 and D800 and you’ll get wildly different results.
- What was the shooting distance? Not many people (myself included) list this with every test, but you can assume a wide-angle is tested very close up, a standard lens at 10 to 20 feet, and a 200mm lens at 30 feet or so.
- What part of the test target is considered ‘the corner’? This can vary from really near the corner to 2/3 of the way between the corner and center.
- What are the corner numbers, really? Is it an average of all corners, the best, the worst, the verticals, etc?
- Did they give you astigmatism data? Not many people do because it makes things complex, but it would be nice if the Imatest reviewers mentioned it. I assume (and I may be wrong) that DxO data doesn’t give astigmatism readings, since it’s analyzing small dots, not angled lines.
- Was best corner focus, or corner results with best center focus reported?
None of this stuff makes computer target analysis bad. It’s actually really good and has several advantages over any other testing methods. BUT, and there’s always a but, it’s giving data for certain conditions, and often incomplete data at that. It’s a really useful starting point, but it’s not an exhaustive report of all the lens’ characteristics.
Optical Bench Testing
I know what you’re thinking. With all of these limitations for target analysis, why not just give optical bench reports. Well, the first reason is pretty simple. A good Imatest lab costs $10,000 to $15,000. (DxO is a lot more expensive – it’s sold as a complete package, including the testing room and lighting). But an optical bench costs from $50,000 to $350,000 depending upon its capabilities.
Still, an optical bench gives us two huge advantages over target analysis:
- It tests the lens at infinity focus, not close up, which can be more real-world.
- It eliminates the variable of the camera body, so you can compare, for example, a Leica lens to a Nikon lens.
It has another advantage for someone like me who has to check a lot of lenses; it’s very automated. Instead of multiple images taken of an Imatest target with careful alignment and manual focus bracketing, you mount the lens, push a button, and the machine does the rest.
How it Works
Optical benches can be oriented either horizontally or vertically. The lens is mounted in a holder and collimated light (parallel rays, like an object at infinity) is shined through a test target onto the lens. A camera at the other end of the lens receives the image and a computer analyzes it to determine the MTF of the lens at that point. The optical bench can either tilt the len or the light source and camera to examine the lens at various angles off-axis.
The projected target is usually a grid of crossed lines so that both tangential (at right angles to the radius of the lens) and sagittal (along the radius from the center to the edge of the lens) MTF can be measured. Occasionally a pinhole or other type of reticle is used.
When measuring a lens at one point, the bench takes measurements at multiple focusing distances (a motor varies the distances by as little as 1 micron), the computer measures each one and plots the best. The bench then tilts the lens a few degrees and repeats the process again and again. The process is fairly quick and in a minute or two the information is plotted as a graph showing a ‘cut’ from one side of the lens to the other.
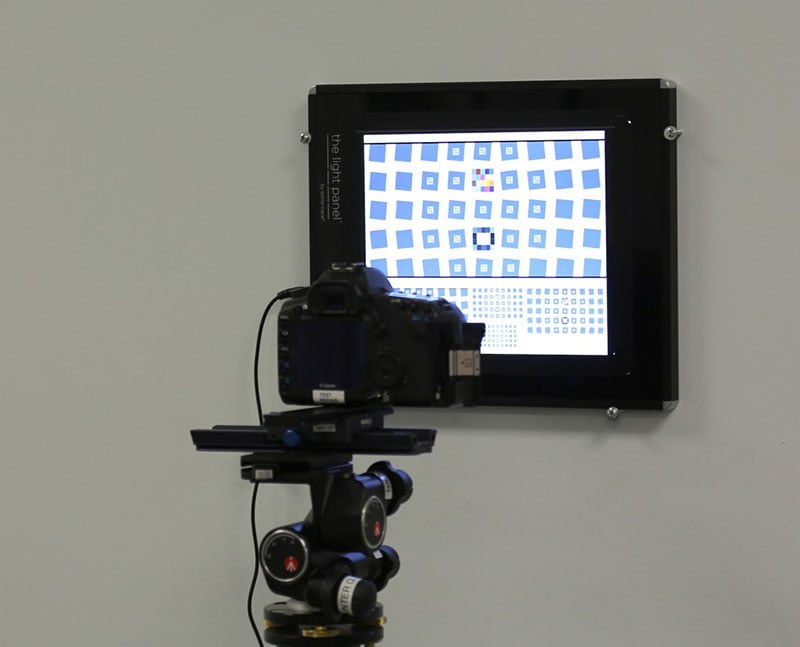
To give you an idea, here’s a quick video showing the bench rotating the lens to various positions, aligning the target reticle automatically, and then the computer screen as it takes a dozen images at each location while altering the focus.
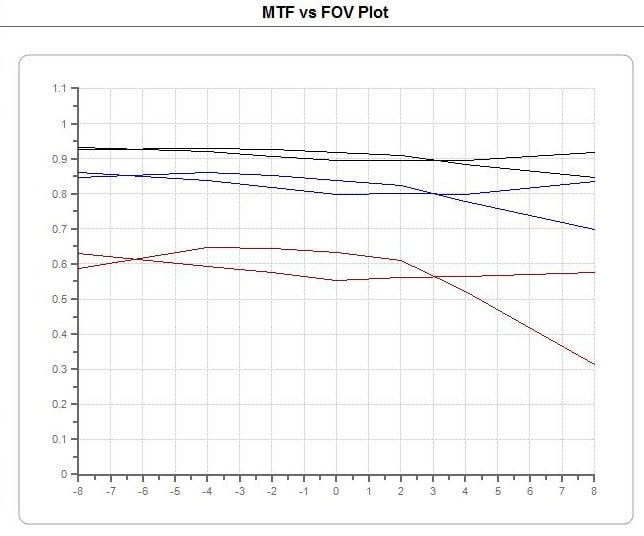
The bench does not give a full two dimensional picture like Imatest or DxO does, it measures a single line across the lens from one side to the other. In the screen shot below, the MTF at 10, 20, and 50 lines is shown from -12 degrees to 12 degrees field of view across the lens.
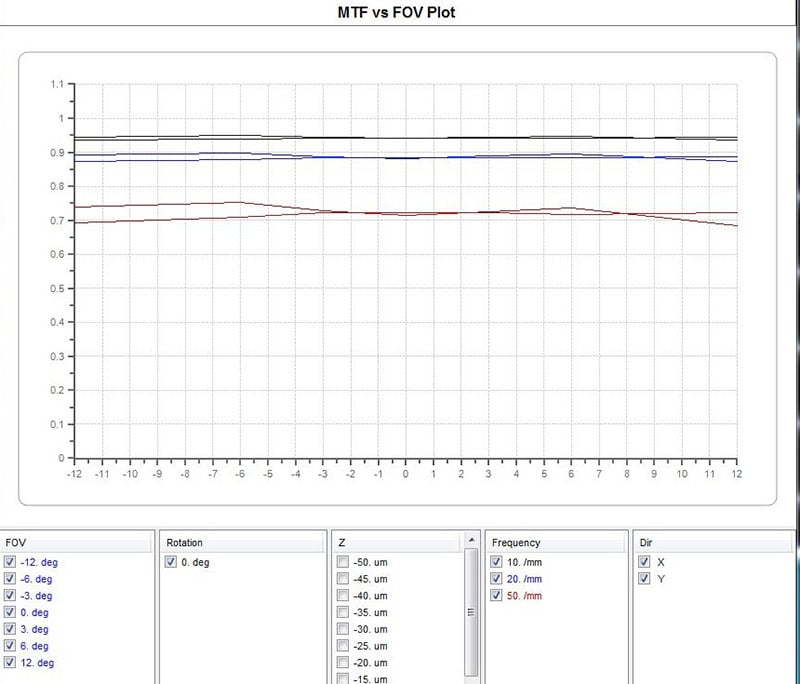
Notice there are two same-color plots for each MTF frequency. One shows the vertical line measurements, the other the horizontal lines. Since this is a single cut across the lens the horizontal line represent the sagittal MTF, while the vertical shows the tangential MTF. This lets us see the degree of astigmatism quite nicely (all lenses have some).
One weakness of the optical bench is that it reads just a single line from one side of the lens to the other. More advanced machines allow you to rotate the lens and repeat the measurements several times. This gives us a two-dimensional look at the lens, which can be very important when we’re testing lenses to make sure they’re within spec. A lens can be tilted or decentered in a way that looks OK in one plane (say from side-t0-side), but if you rotate the lens 45 or 90 degrees in the mount the readings can be quite different. The examples below show readings for one lens taken at 0, 45, and 90 degrees rotation.
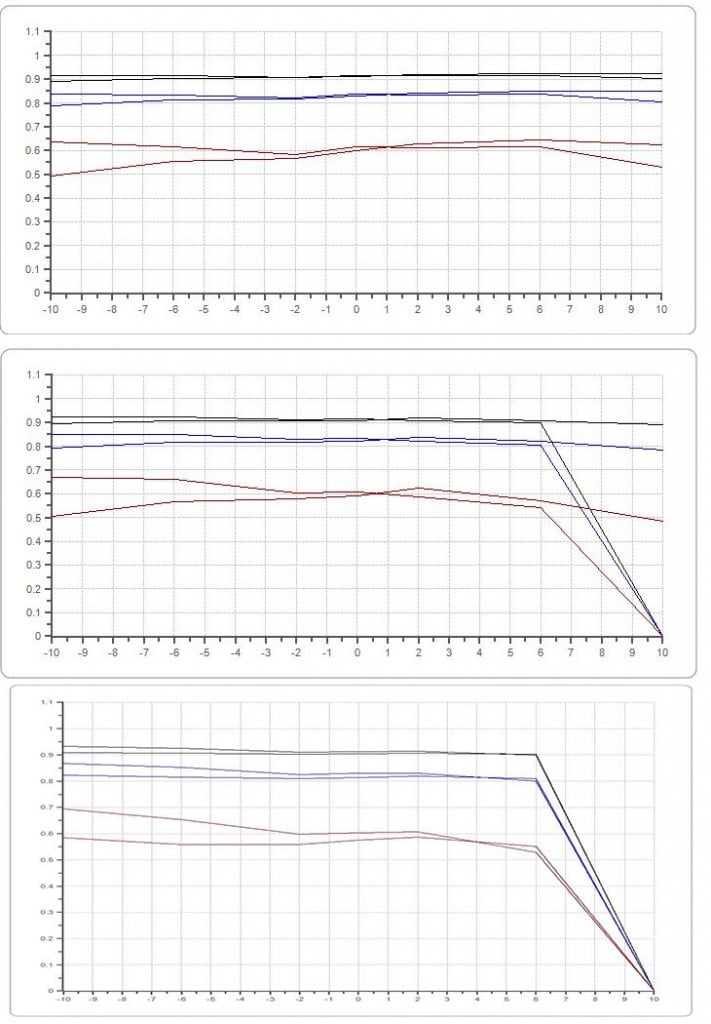
One thing that has to be considered, though, is that the optical bench can overread things a bit. For example, the lens above looks awful on the bench, but really had just a bit of right upper corner softness when tested optically on test charts. Truth is, our inspection techs missed it, and I would have too if I hadn’t been looking for it very carefully.
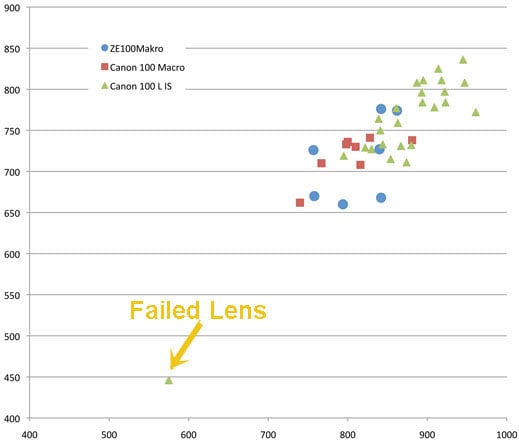
Here’s another example that should give some idea of what a really bad lens looks like on the bench. The upper print out is from a good copy, the lower one from a copy that was obviously soft.
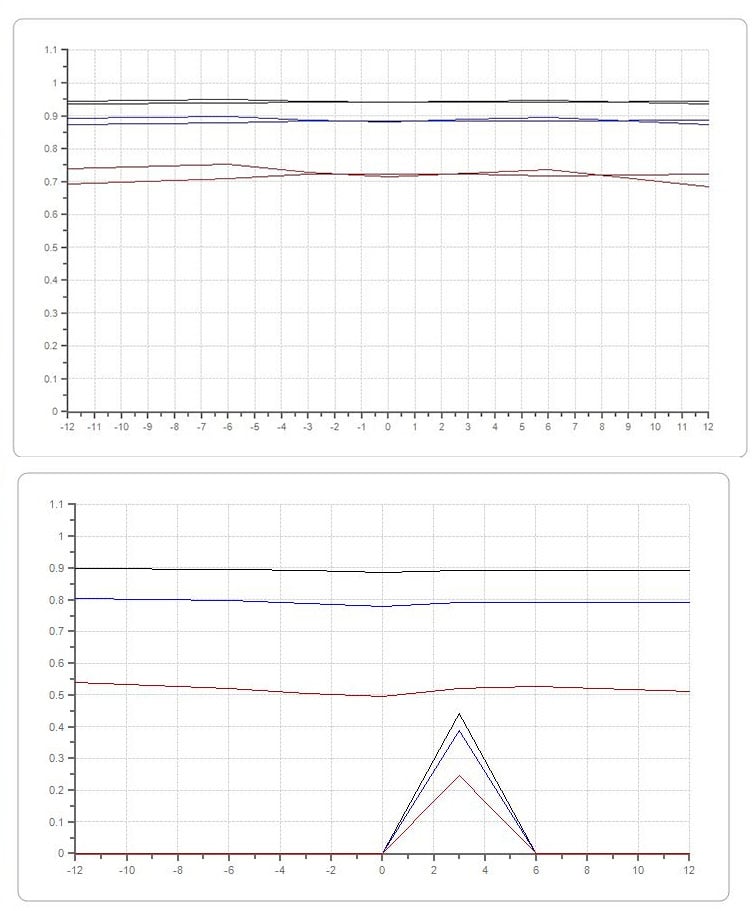
Here’s another example combined with a real world shot. Below is a 100 Macro lens that looks to have a lot of astigmatism (notice how the two lines at each frequency don’t line up) according to the optical bench.
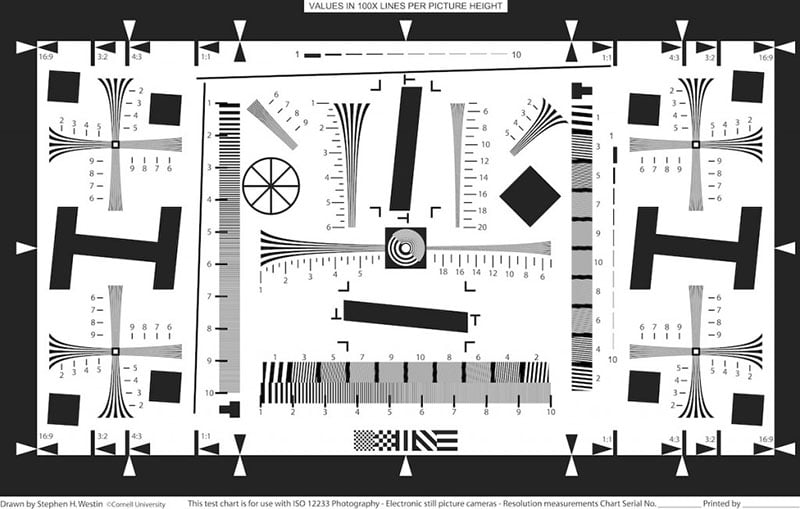
In reality, it is noticeable, but not horrible. Here are 100% crops of the lower corners of an ISO 12233 chart photographed with that same lens (this was the worst location for this lens). You can see that the right lower corner has softer horizontal lines, while the left corner has softer vertical lines.
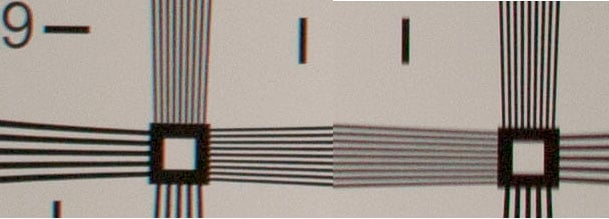
In reality, though, chances are when taking pictures you might (although probably would not) notice the lower corners were just a bit soft.
Disadvantages of the Optical Bench
The weaknesses of the optical bench tend to be almost the opposite of the weaknesses of Computerized Target Testing.
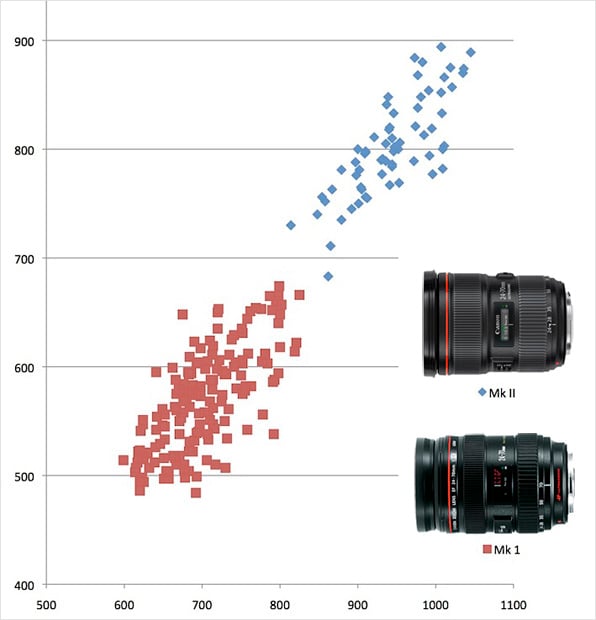
It tests just a lens, not a system: That’s better in some ways. Using a bench we could, for example, compare the Canon, Tamron, Nikon, and Sigma 24-70 f/2.8 lenses and calculate which is best. But this isn’t really as useful as you might think. For one thing, you’re going to shoot whichever lens you choose on a certain camera body. The camera-plus-lens combination is probably a more real-world test than simply testing the lens itself.
Different sensor microlenses may make the corners or edges look much different on a certain camera than they appear to the bench. (If you don’t understand how this is so, find someone who shoots rangefinder lenses on an NEX camera.) And we won’t even get into cameras that pre-process RAW images and how distortion in-camera control might change resolution. So in some ways, seeing the camera-lens combination tested might be more real world than optical bench results.
Focus Distance: Infinity focus distance is great and much more appropriate for lenses that will be used to shoot landscapes, etc. But it might be more appropriate to test a portrait lens at a reasonably close-up distance rather than infinity. Similarly, testing Macro lenses at infinity is probably worse than my original tests done at 8 foot distances. There are some optical benches that can also test at closer focusing distances but they are extremely expensive unless they only test on-axis.
It’s Less Intuitive: If you scroll back up to the Imatest and DxO test charts above, you can look at them in two dimensions like you would a picture taken through the lens. If the right lower corner of the Imatest readings are poor, the lens is poor in the right lower corner. Looking at several lines taken at various angles with the optical bench just isn’t the same.
Far Corners and Wide Angle Lenses: Depending upon the price, an optical bench has a limitation of how great an angle off-axis it can evaluate the lens at. The best one I know of is the Trioptics Imagemaster, which has a 94 degree field of view (equivalent to about a 20mm lens on a full-frame camera). Most are not quite that wide, and a 50 degree field of view (about 45mm) is more common.
This isn’t a problem for screening lenses because the bench is so sensitive it detects decentering without needing to get anywhere near the corners. For lab-testing reviewers, though, it’s a deal breaker. They have to give you corner information, even if it’s corner information at a 4 foot focusing distance.
Lens Size and Focal Length: Imatest and DxO can be used with lenses of any size as long as you have proper support (and a long enough room). As you can tell from the video, the small optical bench I’ve been able to afford isn’t going to be usable with a very large lens. It will handle a 24-70 f/2.8 size lens just fine, but a 70-200 f/2.8 lens is too big to fit.
A larger, vertical bench will be able to handle reasonably large lenses (300 f/2.8 size), but at a cost similar to a small house. There are even bigger benches that can handle almost any size lens, but those cost truly amazing amounts of money. There are also some limitations for focal lengths depending upon optical paths and physical size of the machine. Few optical benches can test lenses over 300mm focal length, and many can only handle 150mm or less.
None of this stuff makes optical bench analysis bad. It’s actually really good and has several advantages over any other testing methods. BUT, and there’s always a but, it’s giving data for certain conditions, and often incomplete data at that. It’s a really useful starting point, but it’s not an exhaustive report of all the lens’ characteristics.
What’s the Bottom Line?
To put it in uber geek terms, both of the testing methods we’ve discussed analyze the point spread function to calculate MTF. One analyzes the entire imaging system, the other analyzes just the lens. One measures at infinity, the other usually closer (sometimes much closer) than infinity. One measures the entire imaging field while the other measures a 2-dimensional line across the imaging field. Each has its advantages and disadvantages.
For testing purposes, I’ll be using both Imatest and an optical bench. Having the ability to check both infinity and near focus is a huge plus (I’ve seen a number of lenses that were out-of-spec at one distance but not another). For wide angle lenses, the optical bench is a probably better for screening, even if it has limitations for lens reviews. Its ability to detect astigmatism is very helpful for wide-aperture prime lenses and the fact that it tests numerous at focusing distances really helps with those lenses that have field curvature. For screening purposes, the bench is faster, easier to set up, and easier to change from one focal length to another change. That’s less of an issue for a lens review where one lens is tested exhaustively.
For macro lenses, physically large lenses, and lenses with very long focal lengths, the optical bench is not particularly useful and Imatest will continue to be our test of choice. Imatest is also a more logical choice for lenses likely to be used at fairly close distances. An 85mm lens, for example, is tested at 12-17 feet in our Imatest lab, which is probably where most portrait photographers are going to use it.
For lens reviewers, though, the ability to test at infinity focusing distance is a huge plus for many lenses. I know there are a few lenses that have amazing test results using computer target analysis, but that don’t seem to perform as well as expected in the real world. I suspect when we look at some of those on an optical bench, we’ll see their performance is more ‘tuned’ for closer focusing distances. Doing some comparison testing using both methods should be fun.
The bottom line, though, is we should read lab tests realizing what is being tested. A lab test may seem to say (as I have done on occasion), “this is an amazing sharp lens”. What that actually means is “this is an amazingly sharp lens at this focus distance, measuring this area of the lens, but not that area, giving you the average number for the 4 corners or edges (or best corner, or whatever), averaging out tangential and sagittal resolution (or just using one of the two), etc. Depending on what was tested and what you shoot, your mileage will almost certainly vary.
About the author: Roger Cicala is the founder of LensRentals. This article was originally published here.
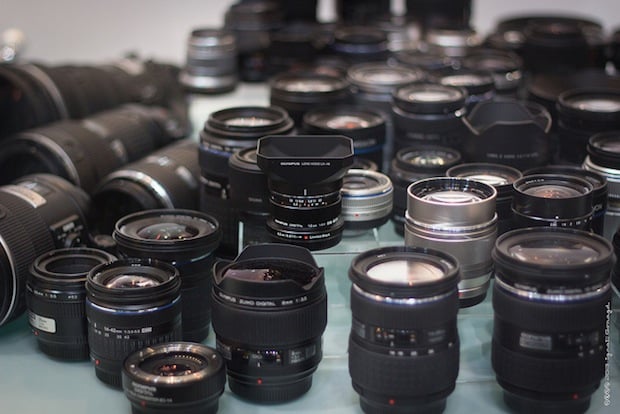
Image credit: Lens testing by Fújur