I Tracked 10,000+ Instagram Likes and Followers. Here’s What I Found.
I tracked over 10,000 likes and followers I received on Instagram in May, 2016. Here’s a look at the data and what I discovered.
Likes Received: 10,491
New Followers: 858
Days Covered: 31
Daily Average: 28
Starting Followers: 24
Ending Followers: 722
Retention Rate: 81%
The following colors are used in all the graphs below:
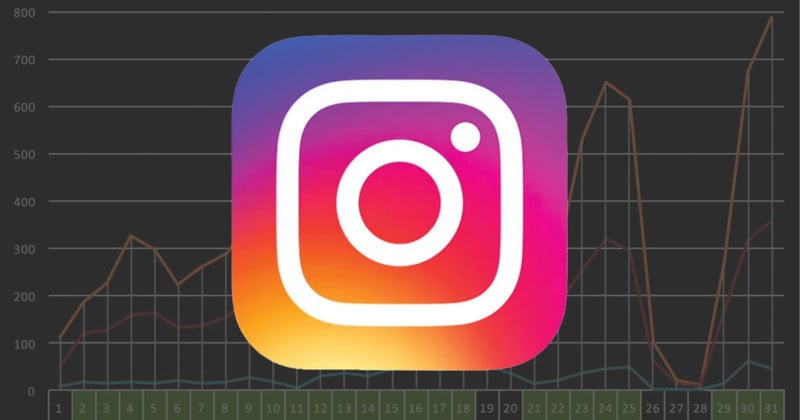
Let’s start looking at the data from different angles.
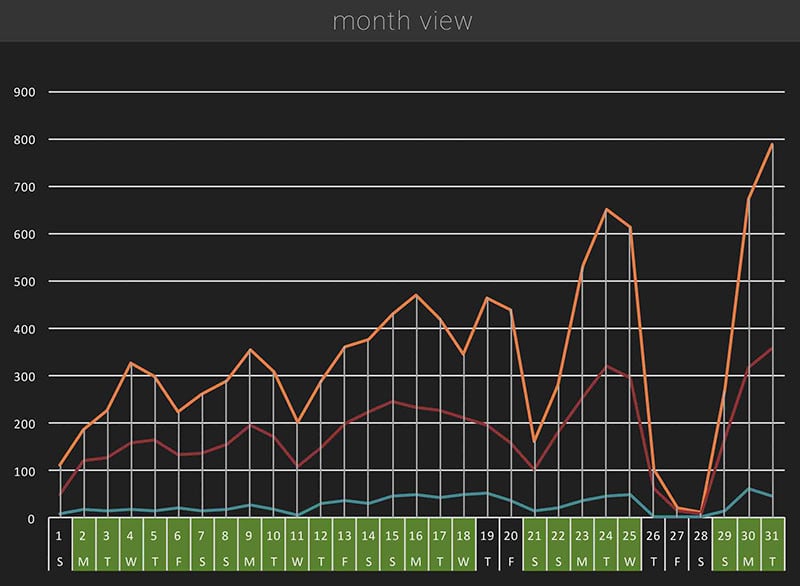
Overall, the number of likes received and new followers gained increased proportionally with the number of posts and followers my account had.
The 6th, 11th, and 18th were surprises. Those photos were my personal favorites, and I thought they would do very well. In reality, they were poorly received.
The 19th and 20th were a test of what happens when I do not post anything, but increase interactions with other accounts, instead. The interactions included likes and comments.
Starting on the 21st, I moved to a 6pm CET posting schedule, hence the lower than usual numbers.
The 26th, 27th, and 28th were a test of how long the existing posts can carry the account, if the account is completely neglected.
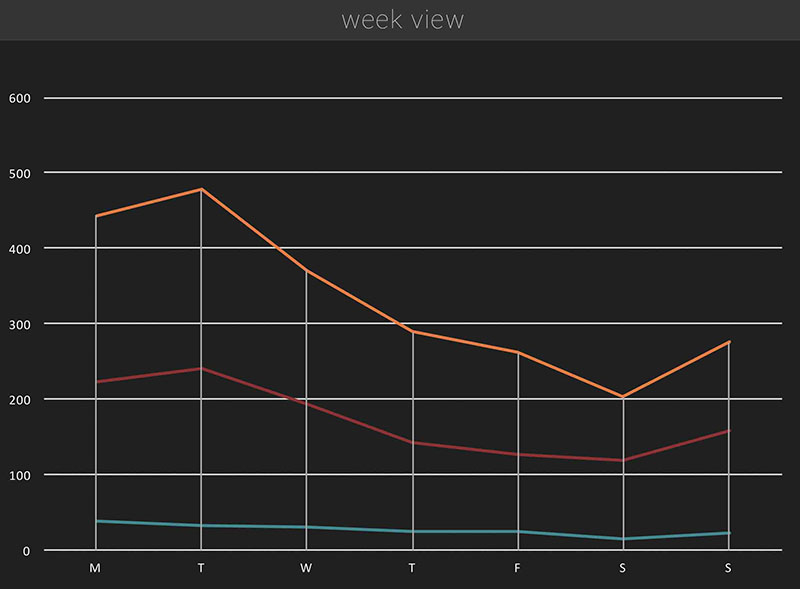
The best days to post are Mondays and Tuesdays. The most likely explanation is that people are still not in the mood to work after the weekend. So instead, they spend more time at work checking Instagram.
The worst days to post are Saturdays. It’s the weekend. More people are out having fun. Checking Instagram is probably not going to be a priority.
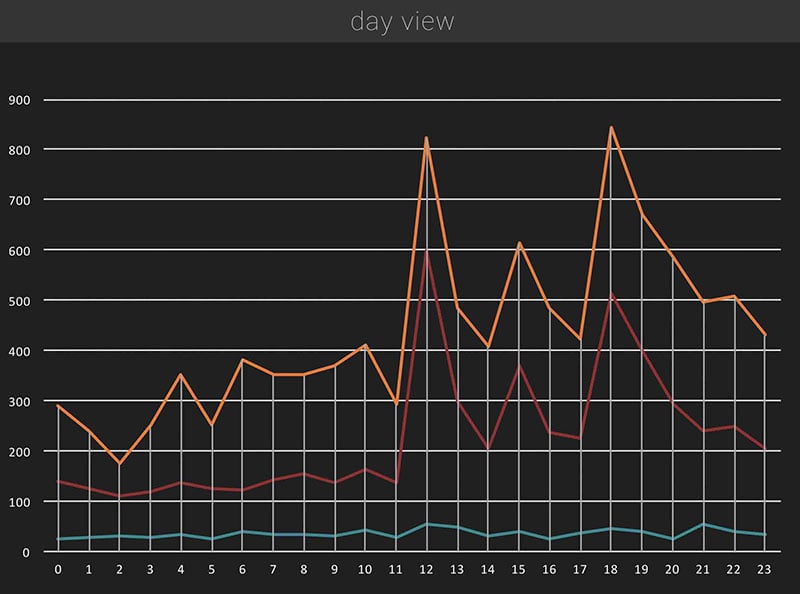
All hours are given in CET (Central European Time), since that’s my timezone.
The “hot” times are 12 (noon), 15 (3pm), and 18 (6pm). Usually, the best time to catch people checking Instagram is when they are not working but also not free to do much, such as lunch time and time spent commuting.
12 is lunch time for Europe and end of day commute for Asia.
15 is start of day commute for US east coast and post-prime time for Asia.
18 is end of day commute for Europe, lunch time for US east coast, and start of day commute for US west coast.
I hope you have found this interesting!
I will keep on tracking this account’s progress. More data means better light on the trends and optimizations inherent within the Instagram ecosystem. As a marketing consultant, that interests me as much as I enjoy taking photos. What can I say? Data can be beautiful, too!
About the author: Aris Lancrescent is a marketing consultant based in Berlin, Germany. You can follow him on Instagram here.