Interesting Visualization of the Instagrams Taken in NYC During Hurricane Sandy
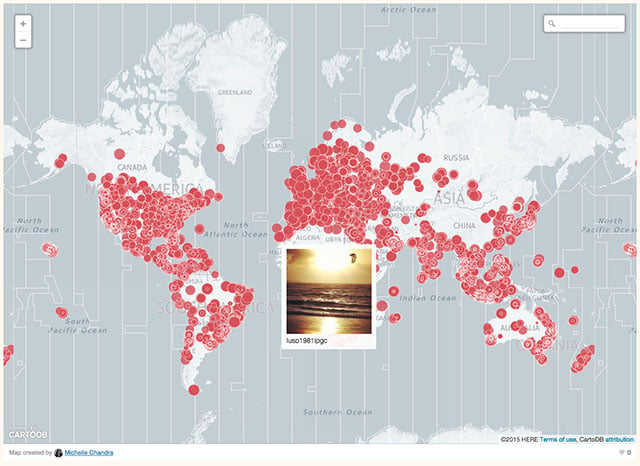
What can we learn about a city or event using Instagram photos? More than you might think. This interesting chart takes a look at what we can learn about Hurricane Sandy, simply by looking at an organized visualization of the Instagram photos taken during the storm.
The chart was put together by the Digital Humanities project Phototrails, and it’s certainly not the first of its kind. They put together visualizations like this all the time, looking at how cities differ from each other, analyzing big events and, as with the chart above, taking a look at crisis situations.
Here’s a quick explanation of what you’re looking at by the team behind the project:
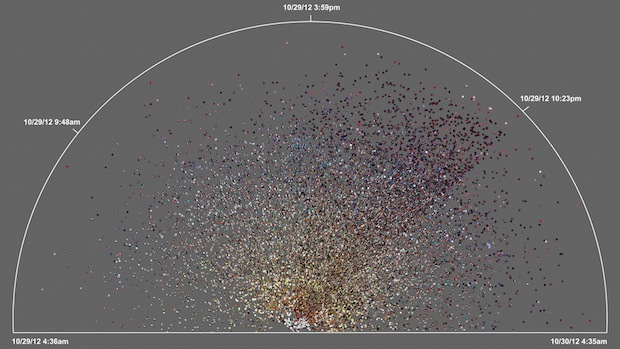
On the left is a radial plot visualization of 23,581 photos taken during 24 hours in Brooklyn area during hurricane Sandy ([October] 29-30th, 2012). The photos are organized by time (angle) and hue (distance from the center). Note the line marking a change in the number of photos and their brightness, corresponding to the moment of the power outage in the area. This sudden and dramatic visual change (compared to normal day and night rhythms seen in our other visualizations) reflects well the intensity of the human experience during the event.
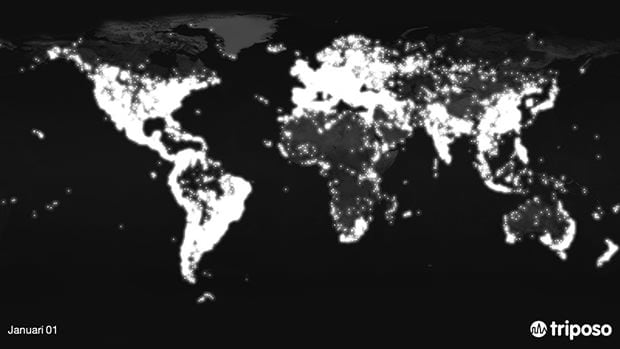
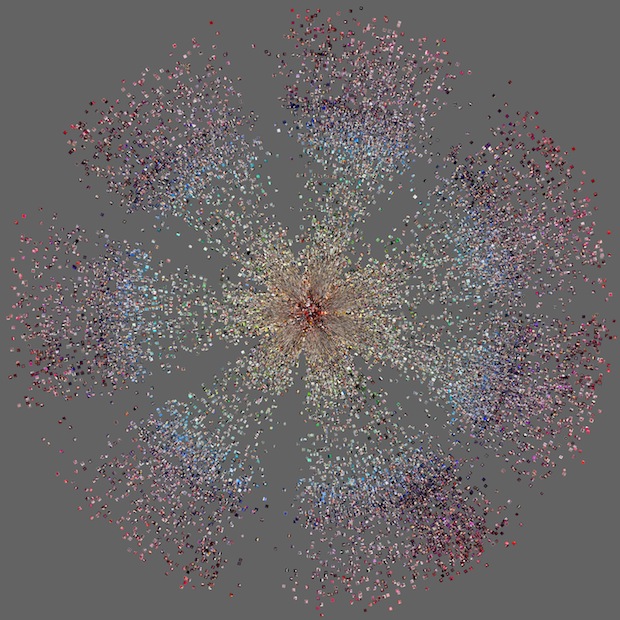
In contrast to the Hurricane Sandy plot at the top, check out this “phototrail” that shows those “normal day and night rhythms” for Tel Aviv. This plot covers April 20-26th:
More than just something interesting or pretty to look at, Phototrails’ charts tell stories — like that of Hurricane Sandy in Brooklyn — using nothing more than Instagram photos organized by location, time and hue.
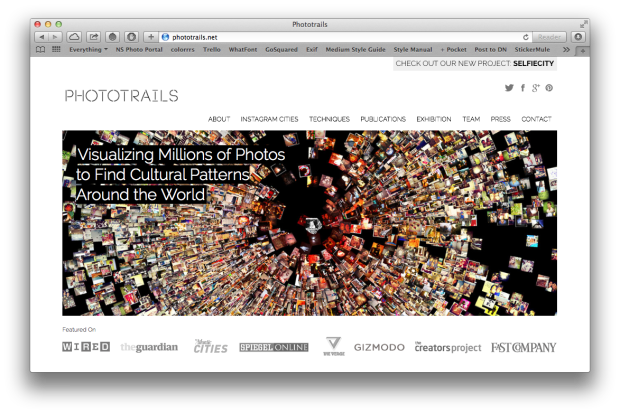
To learn more about Phototrails work or take a closer look at these or the other charts they’ve put together — each chart is zoomable so you can see the individual Instagram photos used to create it — head over to Phototrails website by following this link.
(via Gizmodo)