Spectroscopy Reveals Details About Cosmic Objects That Simple Photos Can’t
Like all cameras, the sophisticated imaging instruments used in telescopes detect wavelengths of light. While some telescopes see in visible light, as human eyes do, others work in wavelengths that people cannot see.
For example, the James Webb Space Telescope’s NIRCam instrument works in near-infrared wavelengths, while MIRI operates in mid-infrared. Scientists and image processors use these images to be able to see cosmological events and objects that are invisible to the human eye. These images are then translated into colors that mimic how different visible light wavelengths appear to humans.
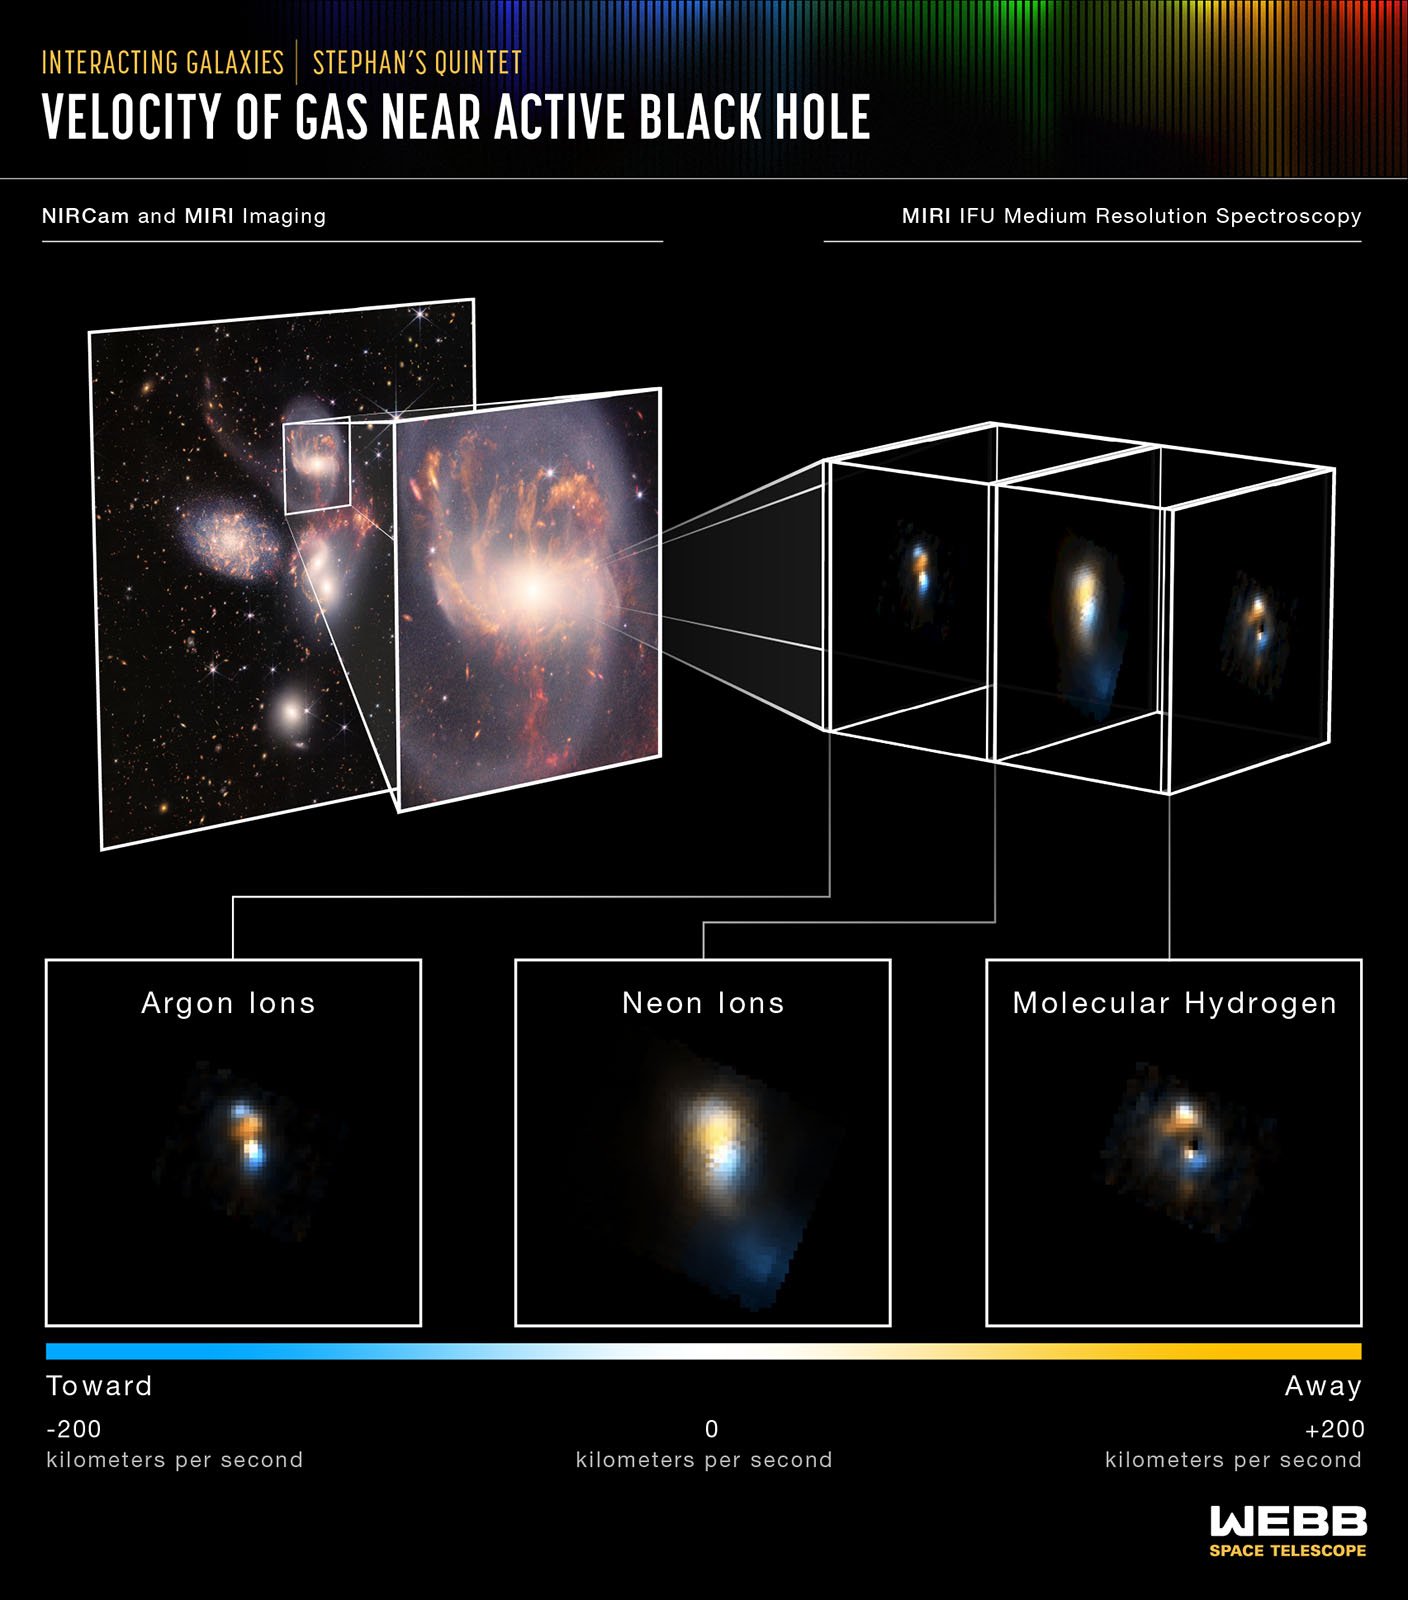
Telescopes detect many different sorts of light, and each type of light reveals a wide range of details about space. Some telescopes, like Webb, also include an instrument called a spectrometer which analyzes the specific wavelengths of light emitted by an object.
Studying these spectra, called spectroscopy, reveals a massive amount of information about an object. By reading light, scientists can determine an object’s size, distance, spin, and chemical composition, even when that object is incredibly far away.
The video above is inspired by NASA’s upcoming X-ray Imaging and Spectroscopy Mission (XRISM). The mission “aims to pry apart high-energy light into the equivalent of an X-ray rainbow.”
“XRISM’s microcalorimeter spectrometer, named Resolve, is a collaboration between JAXA and NASA. It will create spectra, measurements of light’s intensity over a range of energies, for X-rays from 400 to 12,000 electron volts. (For comparison, visible light energies range from about 2 to 3 electron volts,)” NASA explains.
On the other hand, Webb captures similar spectra, but only for infrared light. Even though telescopes like Webb are remarkably powerful and can see extremely distant objects, some objects remain impossible to directly image. They may appear as just a handful of pixels in an image.
“Spectroscopy is the study of how matter interacts with light,” explains NASA Goddard video producer Sophia Roberts.
Webb’s Near-Infrared Imager and Slitless Spectrograph (NIRISS) captures data that “flutters the heartstrings of scientists,” as Roberts says. Looking at a transmission spectrum from NIRISS of the exoplanet WASP-96 b, it is possible to detect and measure key gases in the planet’s atmosphere based on the absorption pattern.
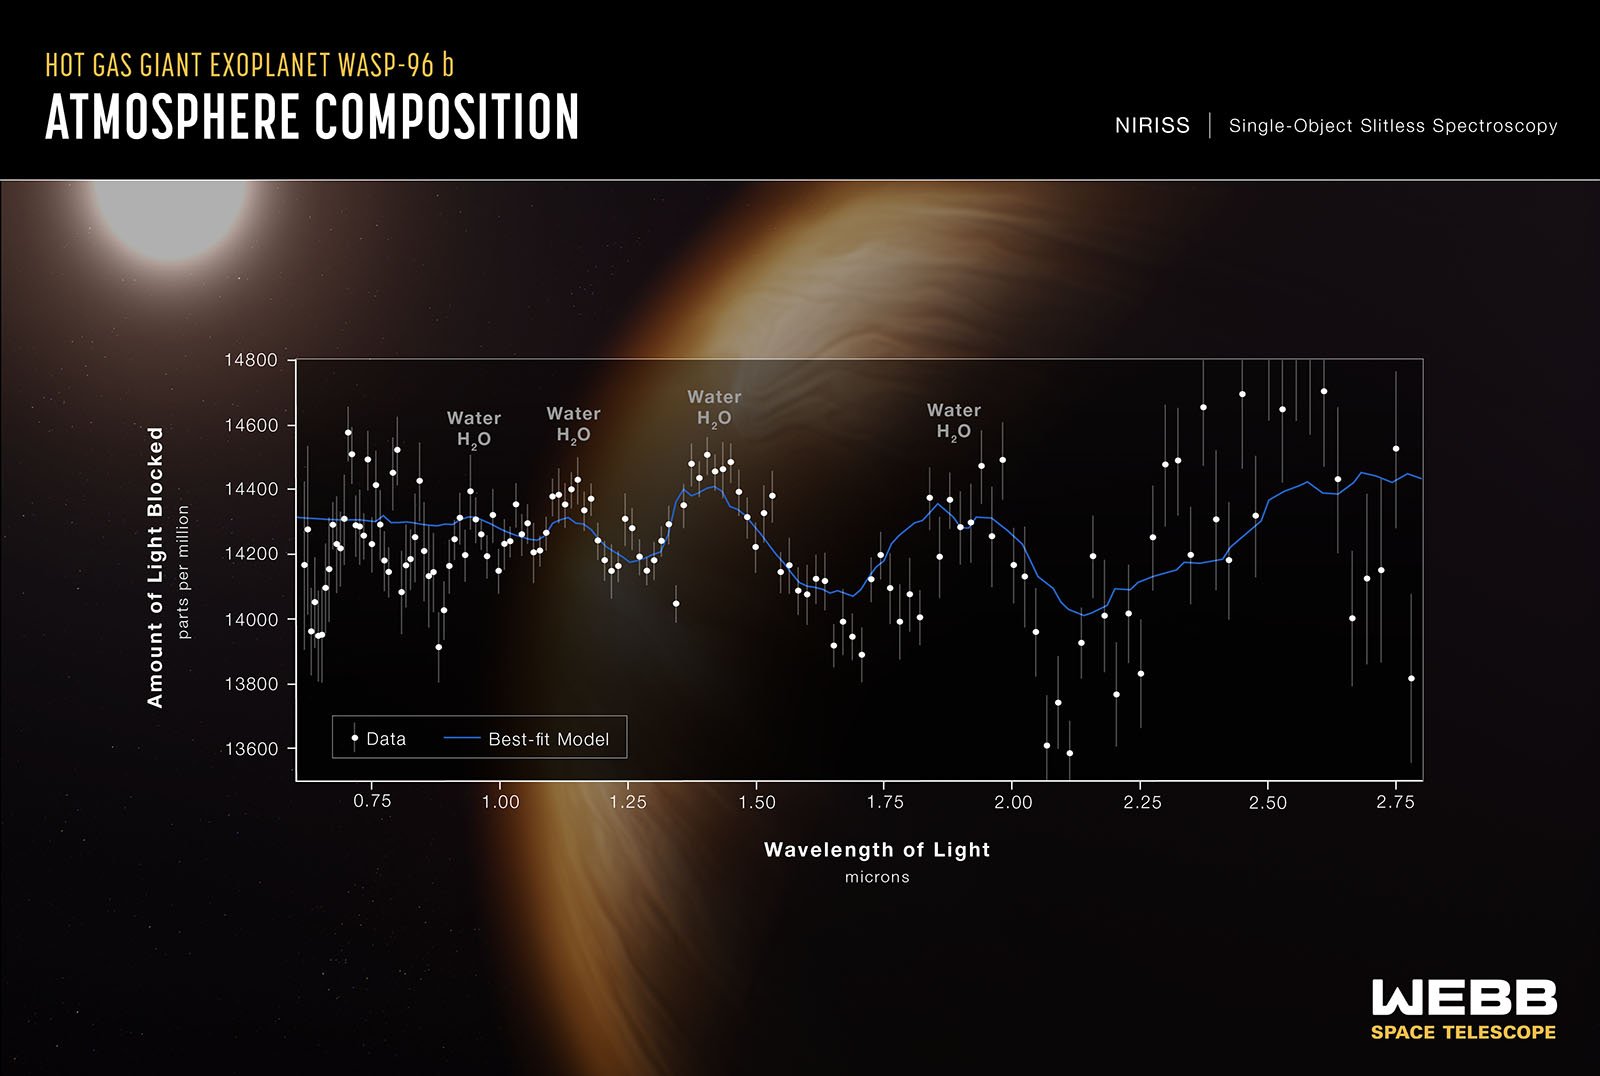
“A transmission spectrum is made by comparing starlight filtered through a planet’s atmosphere as it moves across the star, to the unfiltered starlight detected when the planet is beside the star. Each of the 141 data points (white circles) on this graph represents the amount of a specific wavelength of light that is blocked by the planet and absorbed by its atmosphere,” the Webb team explains.
“Researchers are able to detect and measure the abundances of key gases in a planet’s atmosphere based on the absorption pattern — the locations and heights of peaks on the graph: each gas has a characteristic set of wavelengths that it absorbs. The temperature of the atmosphere can be calculated based in part on the height of the peaks: a hotter planet has taller peaks. Other characteristics, like the presence of haze and clouds, can be inferred based on the overall shape of different portions of the spectrum,” the team continues.
Exoplanets are too dim and often too distant to directly image, so spectroscopy is the only way to ascertain important information about a planet’s composition, and perhaps even locate planets that can support life.
Image creditsNASA’s Goddard Space Flight Center produced the featured video