Lightroom Dashboard Can Help You Visualize Your Photography Habits
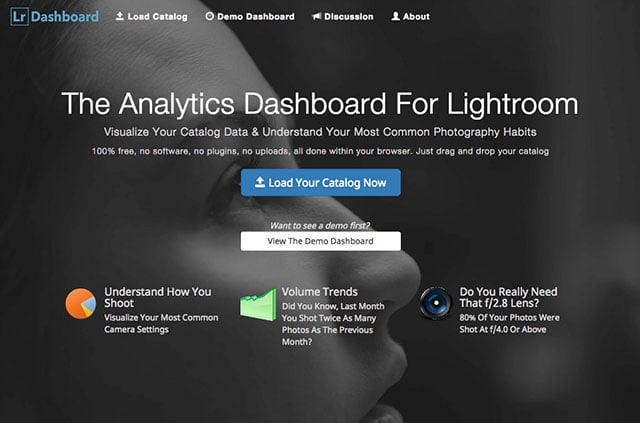
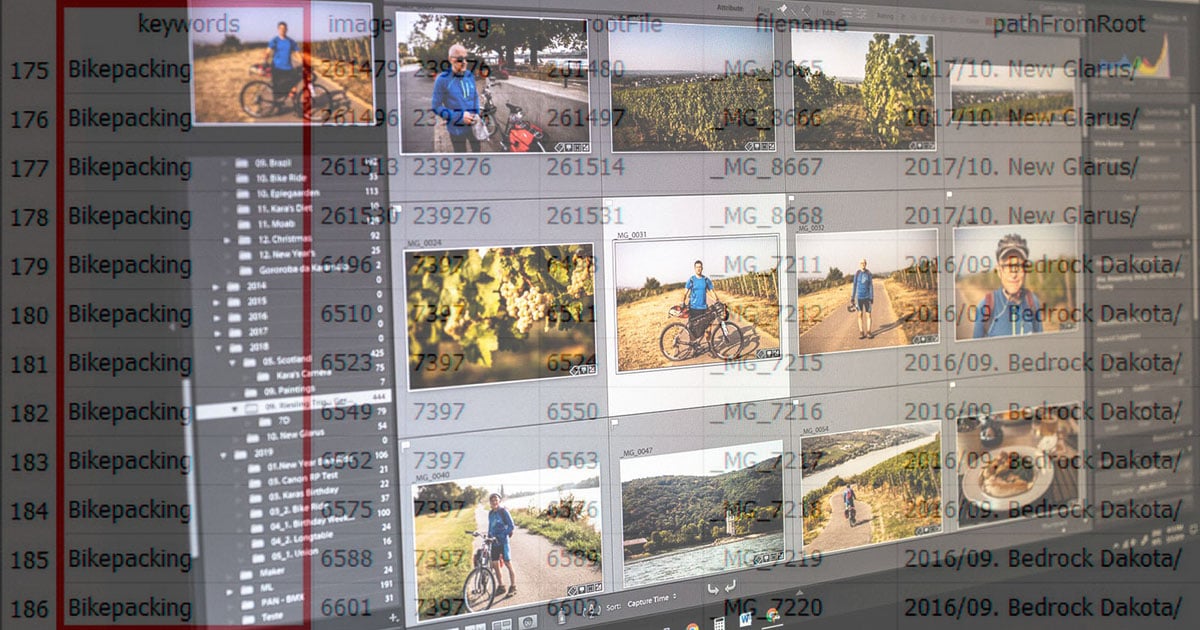
Lightroom Dashboard is a new browser-based app that helps you visualize your Lightroom catalog data and surface interesting details about your personal photography habits. To get started in using the service, all you need to do is drag and drop your catalog into your browser.
Once Lightroom Dashboard has examined your catalog and crunched the data, it turns the data into useful figures and charts for you. If you’d like to see what the app does, there’s a Demo Dashboard that lets you poke around without having to use your own catalog.
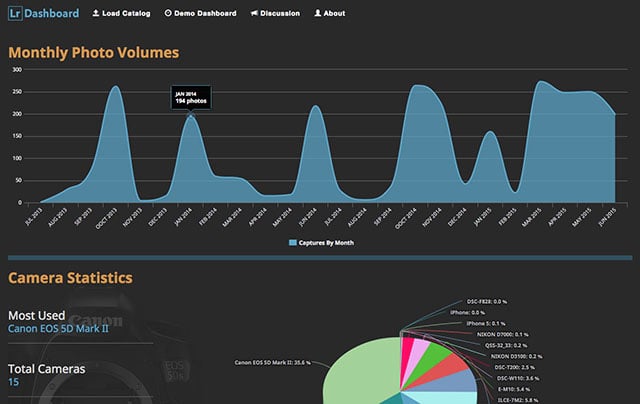
The first thing you’ll see is your average monthly photo volume over the past many months:
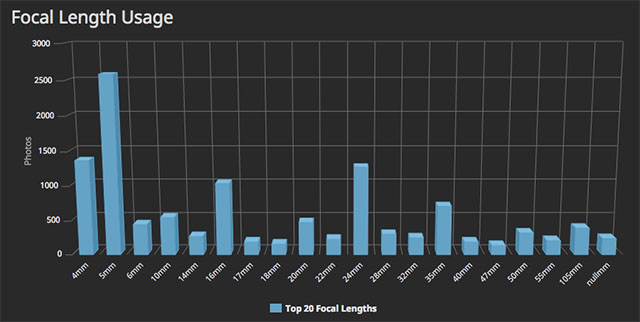
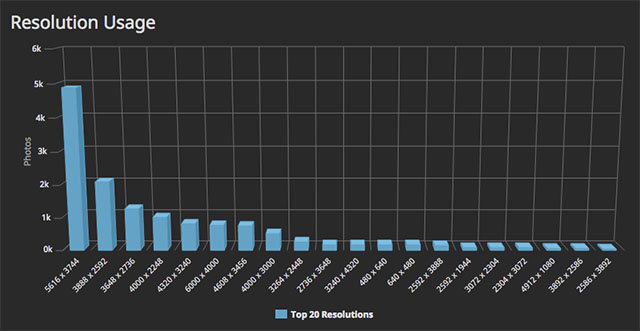
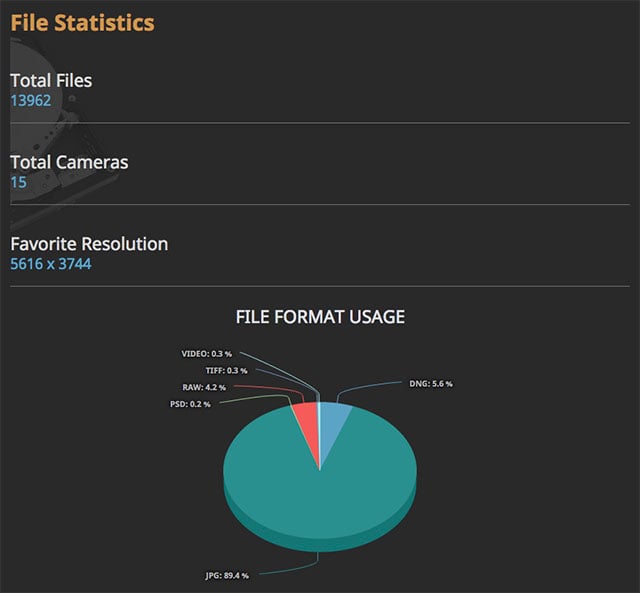
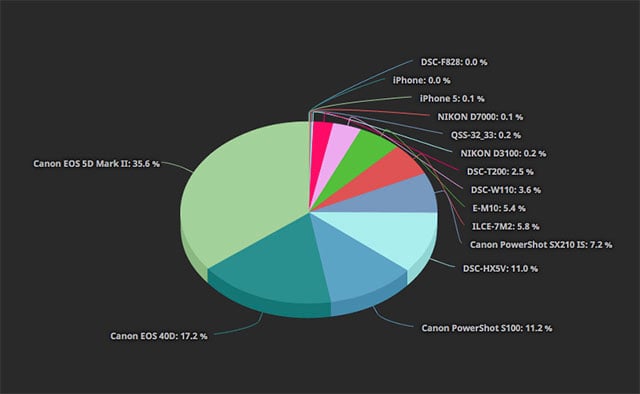
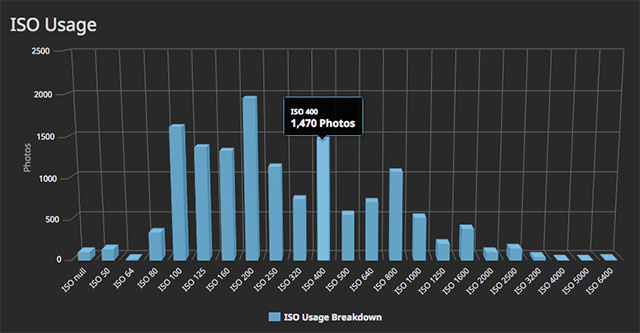
Here are some more examples of what you’ll find on the page:
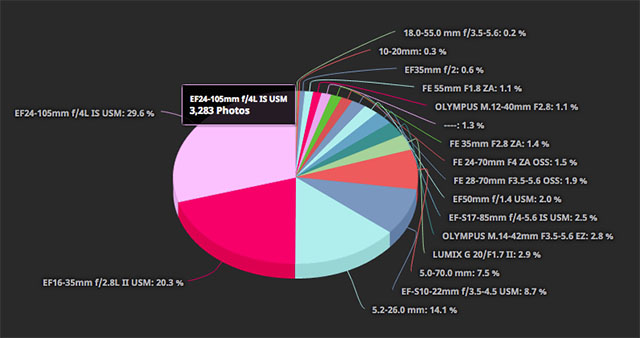
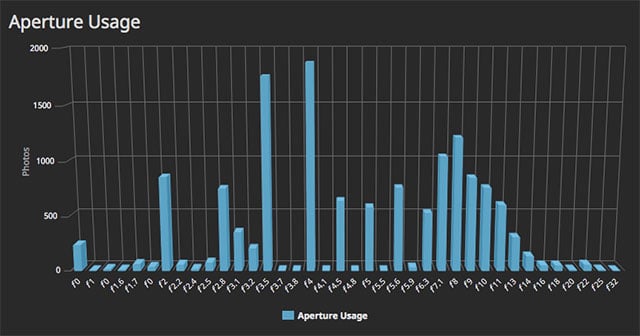
Lightroom Dashboard is “a useful tool to you can use to determine if you really need that new 16-35 lens or if you would actually that new f/2.8 lens,” photographer and developer Cheyne Wallace tells PetaPixel. “I released it only a few days ago and will be making revisions to it as people ask for more features.”
To get started, head on over to the Lightroom Dashboard website with your Lightroom catalog in hand. Happy visualizing!