Animated Map Charts Intense Gamma-Ray Blasts Across the Universe
NASA has released a stunning animation that maps gamma-ray light blasting across the universe over a period of one year.
In the vast cosmos, gamma rays put on a dazzling fireworks show that is missed by humans thanks to our eyesight limitations.
But the Fermi Gamma-ray Space Telescope in low Earth orbit images the light, which has the most energy in the electromagnetic spectrum, and scientists have mapped all activity from February 2022 to February 2023.
The pulsing purple circles represent some 1,525 sources of gamma radiation, each frame marks three days’ worth of data.
“Each object’s magenta circle grows as it brightens and shrinks as it dims. Some objects fluctuate throughout the entire year,” NASA writes in a press release.
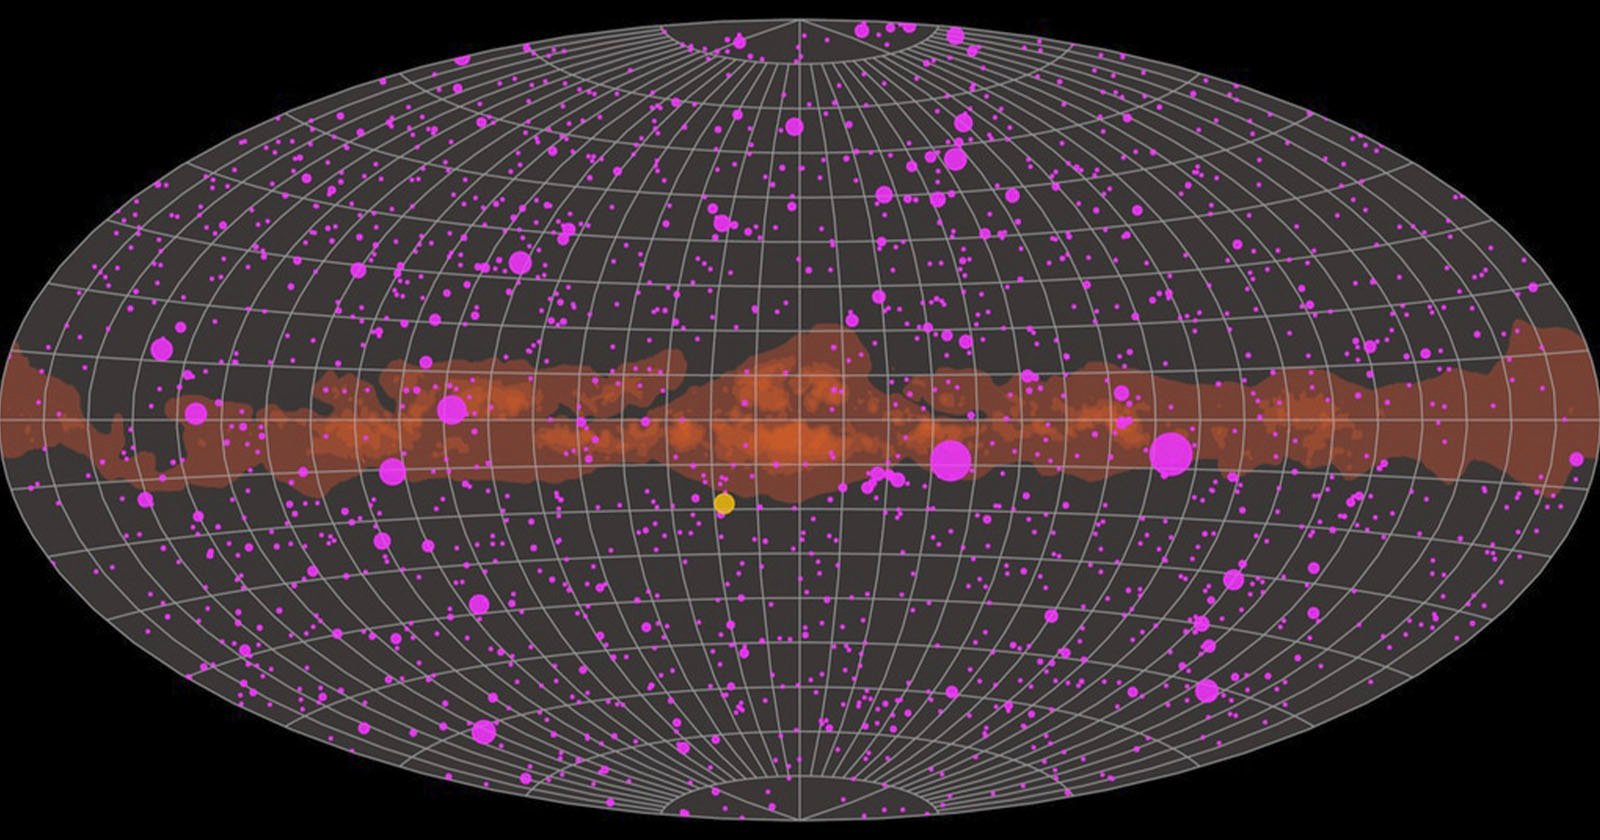
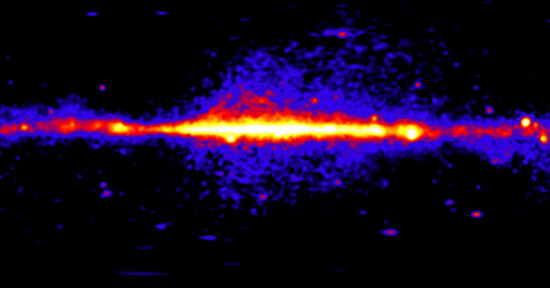
The red and orange band across the middle of the image is the central plane of the Milky Way galaxy which is a constant producer of gamma-ray light. The yellow dot that circles around the map is the Sun’s path over a year.
It took three months, or “400 computer years,” to process all the data that the Fermi gamma-ray telescope captured. Researchers used over 1,000 nodes on a computer cluster located at the SLAC National Accelerator Laboratory in Menlo Park, California.
Fermi utilizes the Large Area Telescope (LAT) which scans the entire sky every three hours. The gamma rays measure from 20 million to over 300 billion electron volts. For comparison, the energy of visible light mostly falls between two to three electron volts.
“We were inspired to put this database together by astronomers who study galaxies and wanted to compare visible and gamma-ray light curves over long time scales,” says astrophysicist Daniel Kocevski of NASA’s Marshall Space Flight Center in Huntsville.
“We were getting requests to process one object at a time. Now the scientific community has access to all the analyzed data for the whole catalog.”
Where are the Gamma-Rays Coming From?
Most of the purple flashes on the map represent gamma rays coming from galaxies known as blazars, a subset of quasar galaxies.
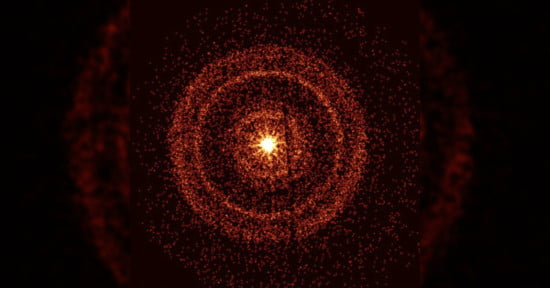
As noted by Science Alert, quasar galaxies have extremely active supermassive black holes that guzzle down material at an awesome rate. The material heats up so that jets of plasma blast across space emitting the brightest light in the universe.
Blazar galaxies are ones pointed directly at Earth so that when they blast out a ray of light, it appears even brighter to gamma radiation observers on Earth.
Blazars account for over 90 percent of the gamma-ray sources in the image above. The other celestial objects emitting gamma radiation include the remnants of supernova explosions and neutron stars.
In the band of orange and red in the middle of the image, which represents the Milky Way galaxy, brighter colors means more intense gamma radiation.
Image credits: NASA’s Marshall Space Flight Center/Daniel Kocevski