Basics of the Histogram: From Foe to Friend
A long, long time ago, that is, in days of film photography, it was a rather difficult task to learn how to produce properly exposed pictures. There was no instant feedback and the only way to see how good of a job you did exposing the scene was to wait until the picture was developed.
Yes, I understand, that strange diagram with mountainous peaks might seem too technical to go into too much, especially when you have an LCD display on the back of your camera showing you the picture you just took. However, I believe that there are a number of ways to improve your photography once you understand how to read the histogram.
In this article, we will explore the technical aspects of it as well as ways to incorporate it with your workflow on the field and in post-processing.
Breaking Down the Histogram
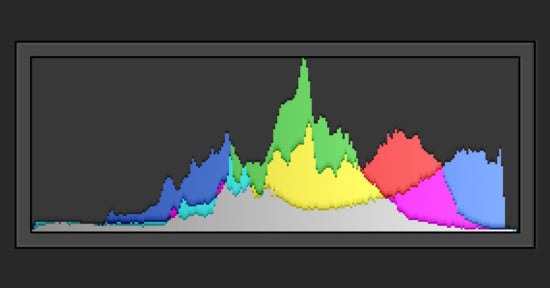
In essence, the histogram is a visual representation of the brightness values of all the pixels in your image. Generally, we use a combined histogram of the three main color channels (red, green and blue) or RGB histogram. However, if needed, you can dwell deeper into the histogram of each individual color channel.
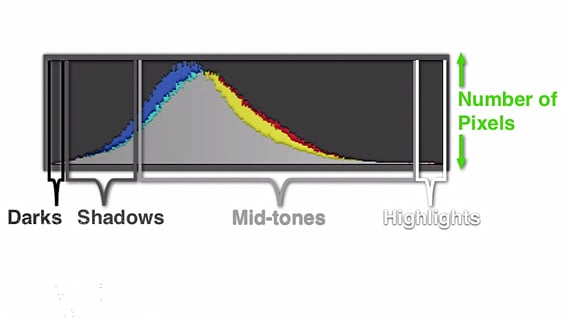
First, let’s try to break down what exactly is represented in the histogram. If you look at any histogram you will notice two axis – horizontal and vertical. The horizontal axis represents the number of tones and their level of brightness, starting from 0 (pure black) up until 255 (pure white). The vertical axis represents the number of pixels at each level of brightness.
So, if you follow the line within the histogram, those highest “mountain peaks” tell you exactly where on the brightness scale you have the most amount of information about the image. If the “mountain peaks” are stacked more towards the left side, even without looking at the actual image, it tells you that it’s dark. On the contrary, if they are towards the right side of the histogram, the image is bright. This is probably the most essential aspect of the histogram that you would need to remember.
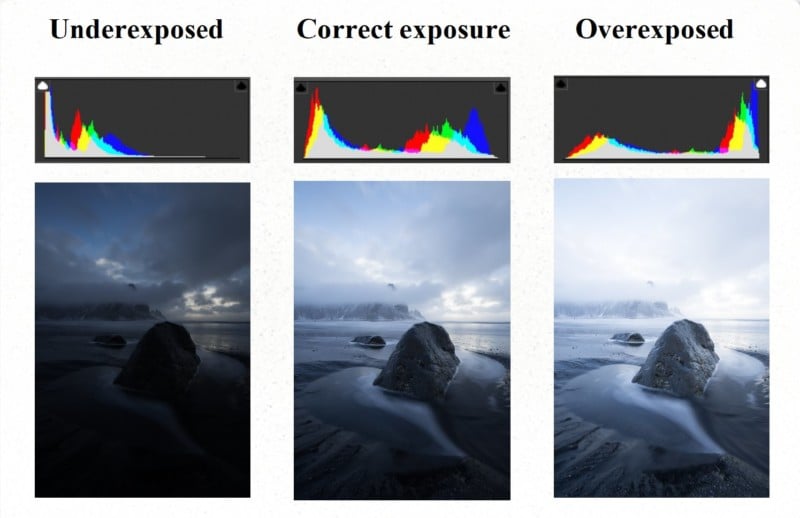
For an image to be correctly exposed, you need to stay within those walls on each side of the histogram. If you expose beyond those walls, in photographic terms we call it clipping. So, if any part of the histogram reaches the right side of the wall, the image is considered to be overexposed and means that every single pixel that reaches this wall, will be represented as pure white.
In simpler terms, all you will see in the overexposed part of the image is nothing else but white pixels. Similarly, if the histogram touches the left side of the wall, it’s considered underexposed and you are left with pure blacks. Take a look at this picture. Here you have a visual representation of how an underexposed, overexposed and correctly exposed histogram looks like.
We established that overexposing and underexposing is something that should generally be avoided, however, there might be situations when dynamic range or difference between the darkest and brightest parts of the scene are so high, that it’s virtually impossible to capture it without clipping either shadows or highlights.
Of course, you can use neutral density graduated filters to compensate for the difference or even bracket the shot and correct the exposure in the final image during post-processing.
Let’s imagine you don’t have these options or the scene is too complex to bracket without failing miserably. In this case, it is advised to underexpose the scene rather than to overexpose. Modern digital cameras are capable to record quite a lot of information about the details in the underexposed areas and bring them out later during the post-processing of the image. However, it is virtually impossible to recover any of the information in the overexposed areas.
Additionally, some cameras are more capable in one thing than the other. For example, Nikon cameras are performing better at recording the details in shadows, so Nikon users have to worry less about underexposing than, for example, Canon users. On the other hand, Canon cameras have a higher capability to record details in the highlights than Nikon users.
Expose to the Right
I would like to mention another aspect of the histogram that might be worthwhile to learn. As I mentioned before, every scene is different and on the whole, there’s no such thing as an ideal histogram as it depends entirely on what are you shooting. However, there’s one piece of advice you might have heard before and I suggest you listen to it: expose to the right!
What it means is that you should generally push the exposure to the brighter levels of the histogram. The reason behind it is simple: the number of tones within the horizontal axis of the histogram. Let’s split the histogram into 5 equal parts starting from left to right, from darkest part to the brightest.
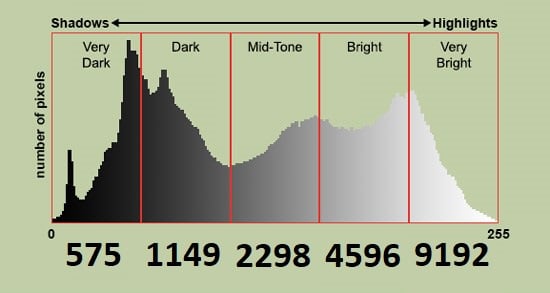
The first section only has 575 tones available, next one has 1149 tones. These two sections make up the so-called darks in the picture. The third section is composed of mid tones and has 2298 tones within it. Last two sections represent the brightest part of the picture and have a combined number of 13,788 tones available.
In simpler terms, if your picture is dark, you will only have a very limited amount of tones available to work with. Let’s say you would like to adjust the picture during the post-processing by increasing the brightness, contrast or do any other changes. Lack of information about the tones will manifest in banding (pixelated gradients), increased noise levels and other problems. On the contrary, if you have a picture that exposed towards the right side of the histogram, you are less likely to run into these problems during post-processing.
The Back of Your Camera Lies
Another important aspect of learning to read the histogram is that once you understand it there is no need to rely solely on LCD display built inside the camera. Why is it a good thing, you ask? Because the LCD display lies!
While it gives a reasonably good interpretation of the image, it’s far from perfect to determine, for example, how correct the exposure is. First of all, the LCD displays only a JPEG preview version of the image, even if you shoot RAW files. Besides, the LCD screen has a much lower resolution than the image itself and the brightness level of the screen might be adjusted too bright or too dim. This is especially important to remember when shooting in very bright or dark conditions.
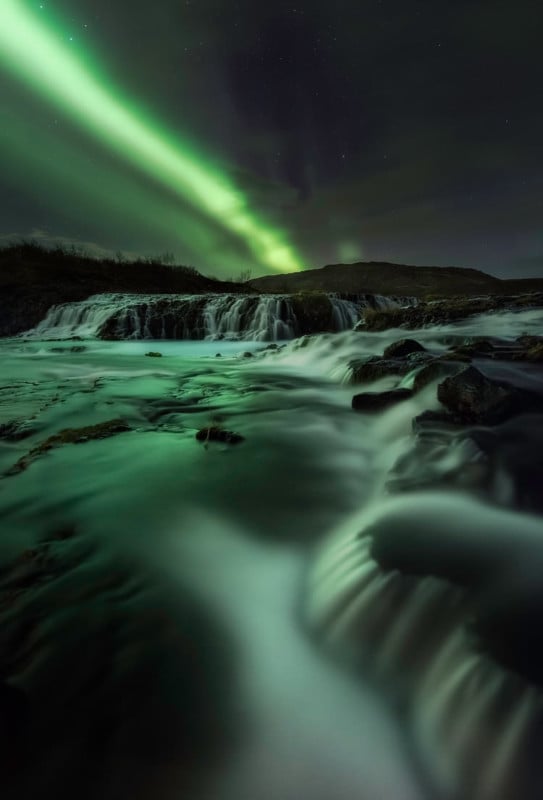
For example, when shooting northern lights, while looking at the screen in these dark conditions, it might seem that the picture on the back of your LCD is correctly exposed, however, this is misleading. This is due to the way how our eyes adjust according to the viewing conditions. In this case, when viewing the picture it in the dark, it will look much brighter than it actually is.
Making Use of This Knowledge
There are a number of ways how to implement an understanding of histogram in a photographer’s workflow. First of all, most of the modern cameras have an ability to represent histogram on an LCD screen even before making a shot – through live view mode. This way you can adjust your exposure exactly, even before taking a shot.
Ideally, I would suggest making it a habit to check the histogram after each shot. If that sounds too tedious, one can at least use “highlight alert” function built in the camera. Once a shot is taken, it is possible to view the image and allow the camera to detect if there are any areas that are overexposed.
Additionally, you can use your knowledge of histogram while making adjustments to an image during the post-processing. Increasing or decreasing brightness might result in lost pixels and to prevent that you can always rely on monitoring the histogram while making sure that no clipping occurs.
It doesn’t necessarily make you a professional just because you are able to read the histogram, but learning it can be very helpful at times. I hope that this article helped you to understand the basic principles behind the histogram and with time you will be able to incorporate this knowledge in your workflow and ultimately improve your photography.
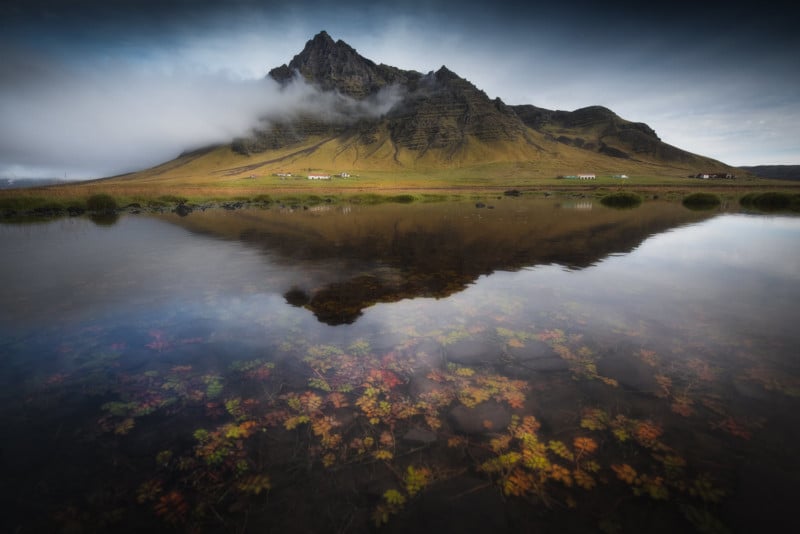
About the author: Kaspars Dzenis is a landscape photographer based in Iceland. The opinions expressed in this article are solely those of the author. Dzenis conducts photo tours and workshops in his country. You can find more of Dzenis’ work on his website, Facebook, Twitter, Flickr, 500px, and Instagram. This article was also published here.