A Primer on Reading and Using Histograms
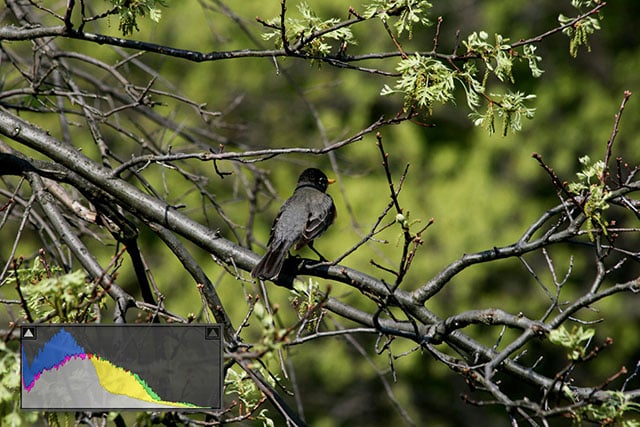
Image histograms are useful tools that can be used to help properly gauge the exposure and contrast within a scene during shooting or to balance the tonality of a photograph in post-production. These days, histogram graphs can be found almost everywhere, with more modern digital cameras including live displays during composition. Today’s primer focuses on how to correctly read histograms and use them to your advantage.
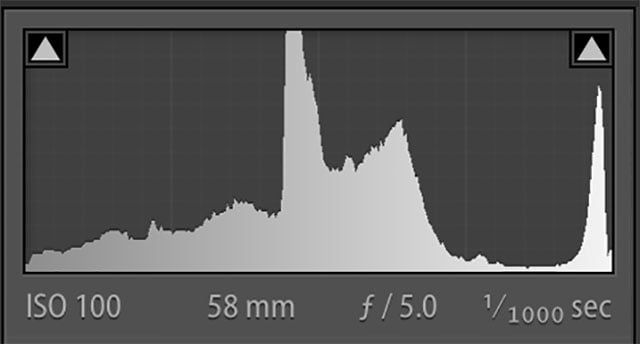
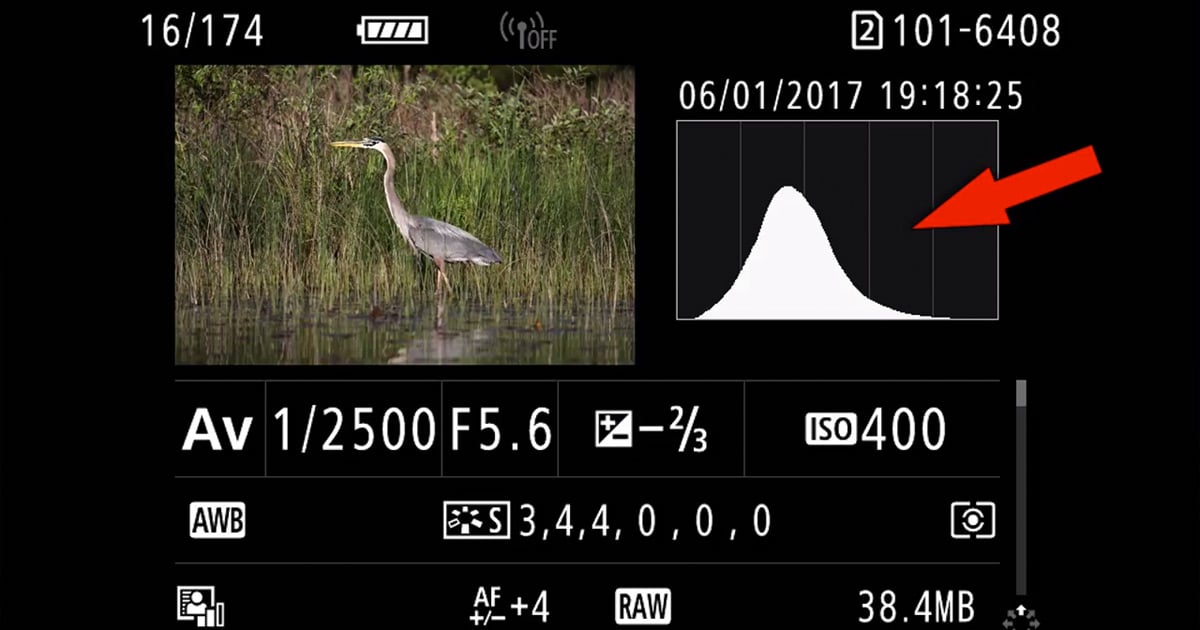
When viewing a histogram, there are two axes that help us interpret the visual data. The horizontal axis represents the differences in tone within a given photograph while the vertical axis represents the number of pixels within that tone. The left side of the graph represents the dark areas of the photo and the right side reprints the light areas.
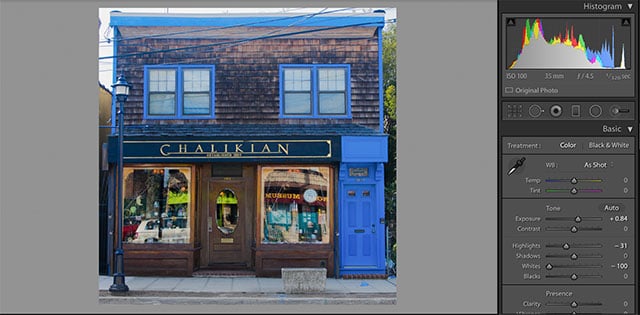
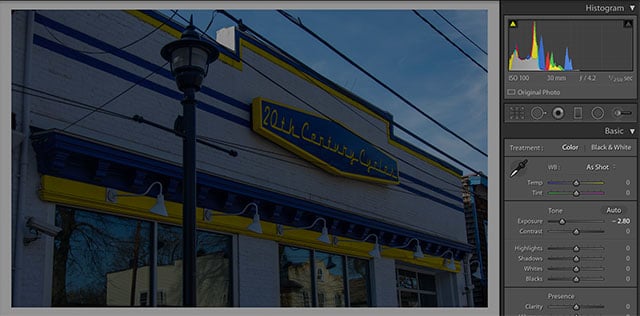
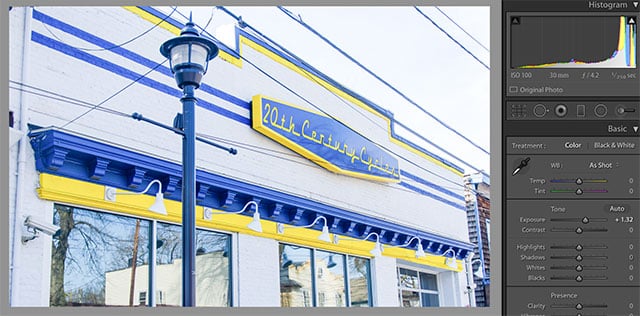
Ideally, in most situations a histogram will take the shape of a bell curve where the majority of the tonal range is exposed correctly. When the graph begins to creep up the left or right sides of the chart, then you are underexposing or overexposing your photograph, respectively.
Not all situations will call for the histogram to be a perfect bell curve. If you are shooting against a white or black backdrop, then the camera will interpret the area as pure black or white and your histogram will be skewed as a result. Also, you may decide that the subject you are shooting is to be low or high key due to creative reasoning.
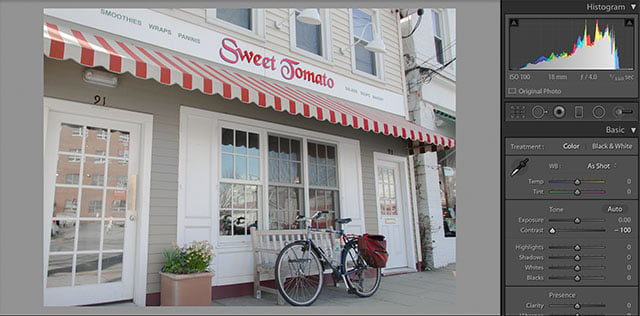
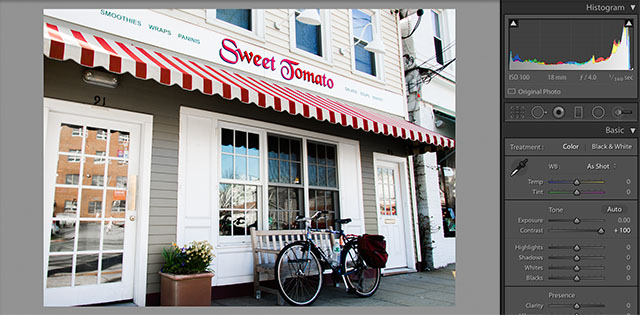
The amount of contrast within a photograph can also be determined by viewing a histogram. Images that have less contrast tend to have a more narrow overall tonal range while photos full of contrast will tend to spread out across the horizontal axis.
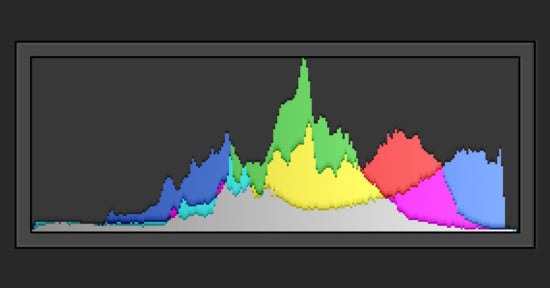
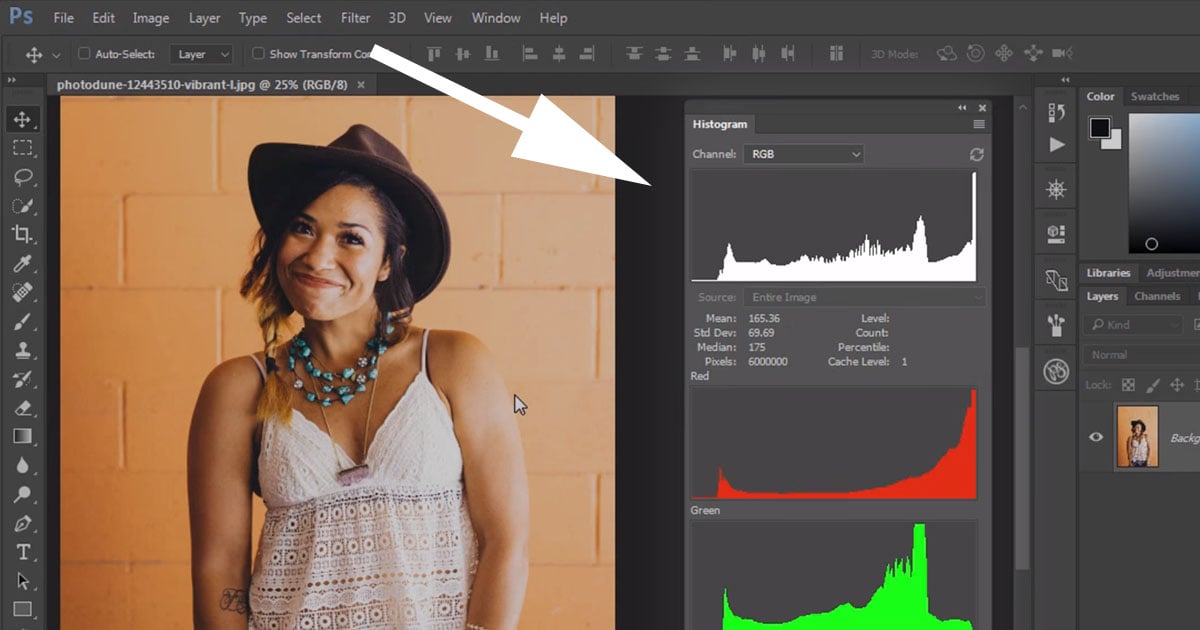
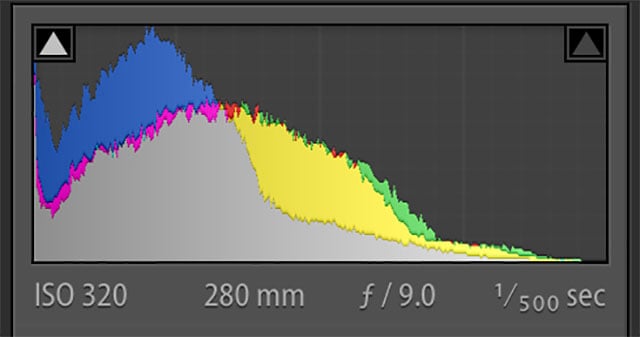
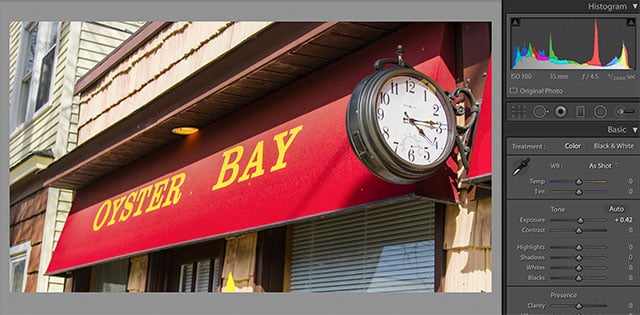
Applications, such as Lightroom, display histogram graphs in multiple colors. The method of using multiple colors allows a photographer to see more clearly what colors are within what tonal range in the image.
If you are a photographer that shoots RAW, then histograms can be helpful but they will not be as accurate. This is due to the fact that histograms showcase the dynamic range of your photograph within a JPEG file. RAW files contain much more dynamic range and can be manipulated to a greater degree after taken.
The best way to become familiar with histograms is the experiment with them. Grab your camera and head outside; snap a picture that is overexposed then one that is underexposed. Notice how the tones begin to shift around the graph. Experiment with contrast and learn to understand how the chart showcases shadows, highlights, and exposure.
Your knowledge of histograms can be utilized to better understand the photographs you are taking. Depending on your camera’s screen, you may not notice that an area of the photo is overexposed or underexposed. Your eyes may deceive you, but the digitally plotted histogram will always be dependable.