Histogram or Artistic Expression: What Matters Most?
How literally should you interpret a histogram? Where do the lines intersect between artistic expression and photographic technicalities? It’s important to first recognize that a histogram is nothing more than a mathematical representation.
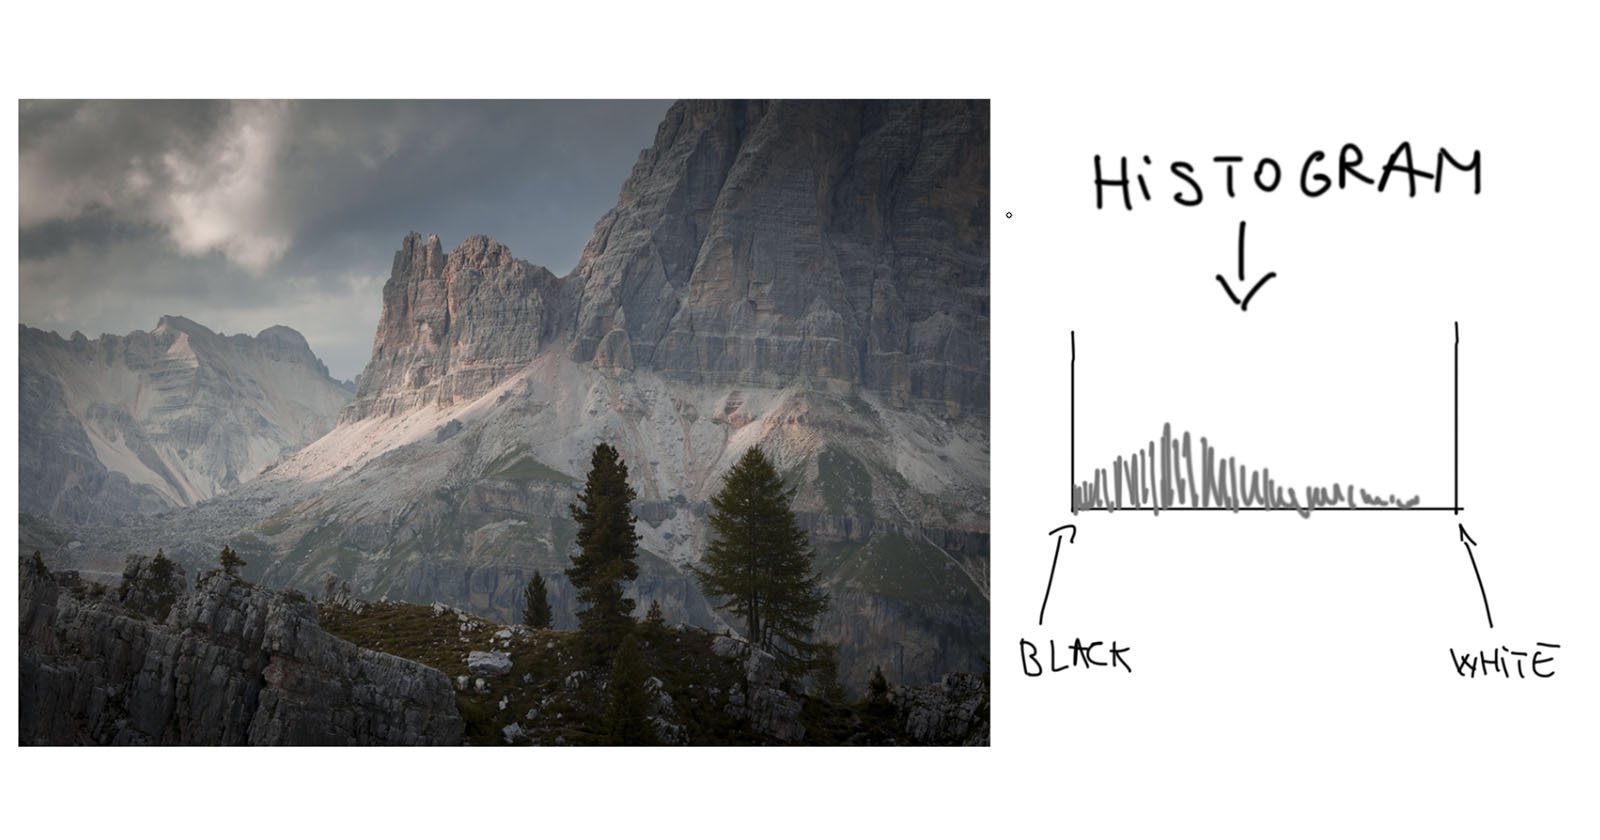
If you look up the definition of histogram you’ll discover this: “A graphical representation of the tonal values of an image.” With that said, I see two use cases for the histogram: as an in-camera exposure guide and a reference tool used during post-processing.
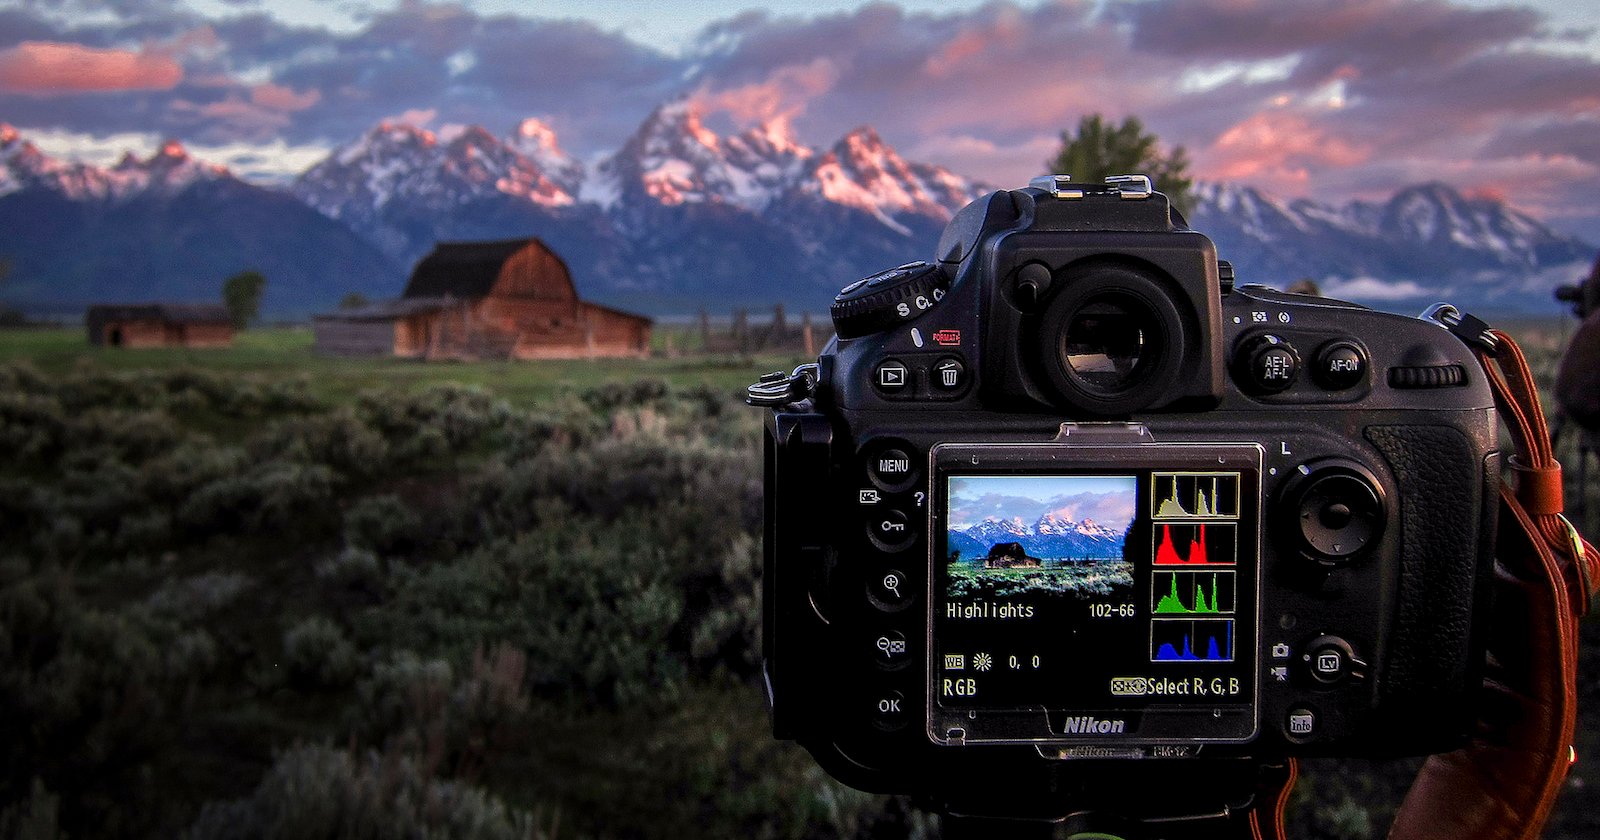
In camera, I use this as a means to quickly determine “acceptable” exposure and to ensure that I’m not losing any detail in the highlights or shadows of my image.
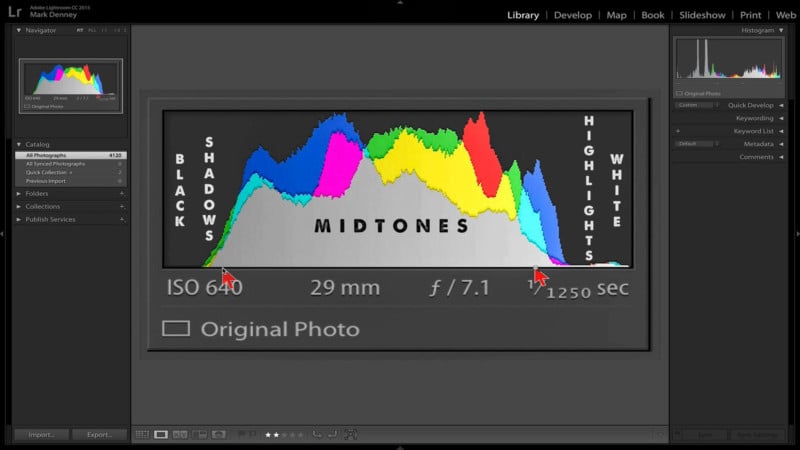
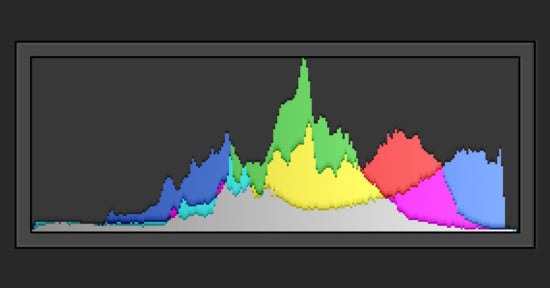
When it comes to post-processing images in Lightroom, you’ll notice a combination of the luminance (grey) and RGB histogram. This might look intimidating at first, but once you spend some time with it, you’ll quickly become comfortable with the information it provides. Along the X-axis, moving from left to right, you have black tones, shadows, mid-tones, highlights and whites..simple as that!
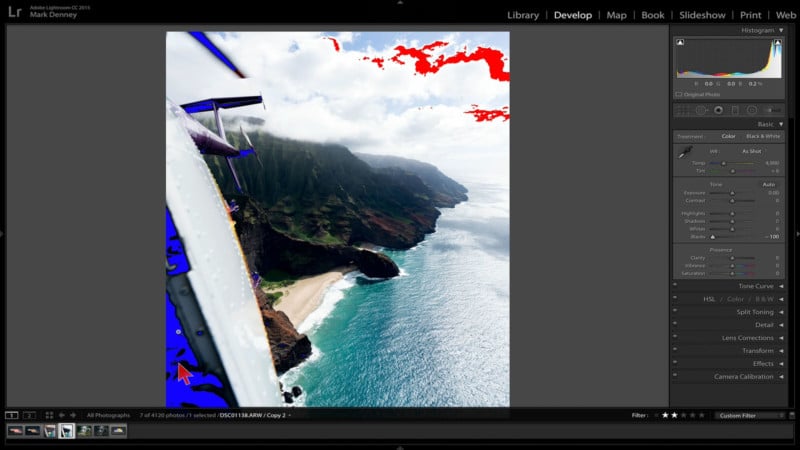
I find the most useful histogram feature in Lightroom to be the clipping indicators that allow you to easily identify areas of your image that have clipped or “blown out” highlights or shadows. In order to see this use the shortcut key (J) to toggle the indicators on and off. Clipped highlights are displayed in red and clipped shadows are visible in blue.
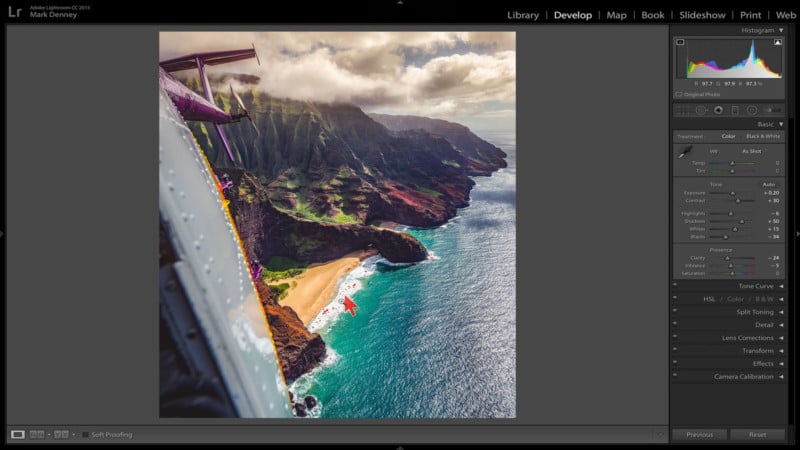
Below is the final image after some additional edits and resolving the clipped areas, notice the difference in the before and after histogram.
So where does this leave us? Once you’re comfortable with how to translate a histogram and understand how to use the resulting information during post-processing, it becomes easier to discern between your artistic vision and the exposure technicalities.
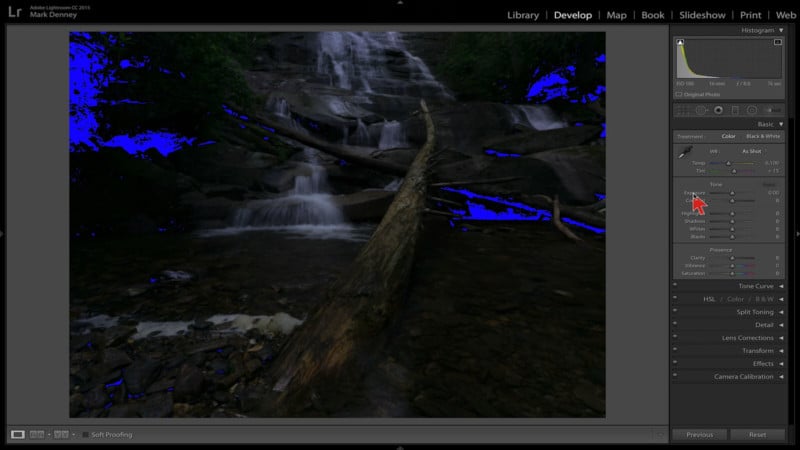
The below example illustrates this point well. This is a RAW file from a recent backpacking trip where I envisioned a dark, subdued image with a moody edge to it, as you can see it’s quite underexposed with a large amount of shadow clipping which I was able to correct.
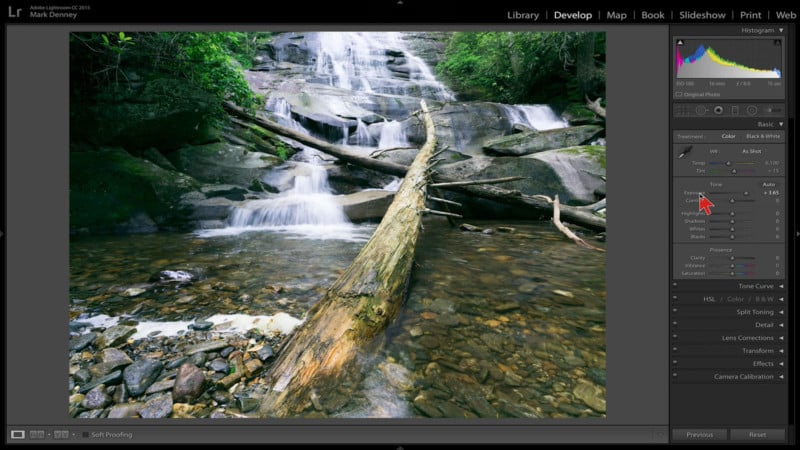
If I hold down ‘Shift’ and double click ‘Exposure’, Lightroom indicates that according to the histogram this image requires over 3.5 additional stops of exposure in order to “properly” expose the photo — below is the result.
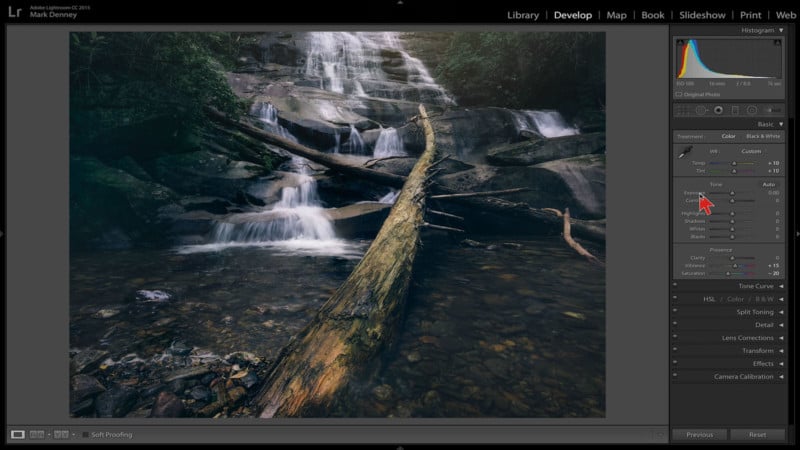
This is obviously not what I envisioned the end result to appear like. Below is the final edit I landed on that closely aligns with my original artistic vision for the scene. If you were to look only at the histogram, you could easily draw the conclusion that this photo was underexposed, but in reality, it’s exactly how I envisioned the end result — I love it!
I believe we all have similar images and situations as this in our portfolios where the photo may not be “technically” sound, but it matches the output in our minds and at the end of the day, that’s really all that truly matters.
P.S. If you enjoyed this video and article, you can find more by subscribing to my YouTube channel.