How to Read and Use the Histogram on Your Camera
Even though photography is an art form and the final result is considered to be an artistic expression of your thoughts and ideas, there is a strong technical side to all of this. You’re using a very advanced technological camera to capture the images and you need to know and understand all sort of technical concepts.
The bottom line is this: nobody cares how it all works. You just need to understand the information that is being presented to you and also how you can use that in your photography.
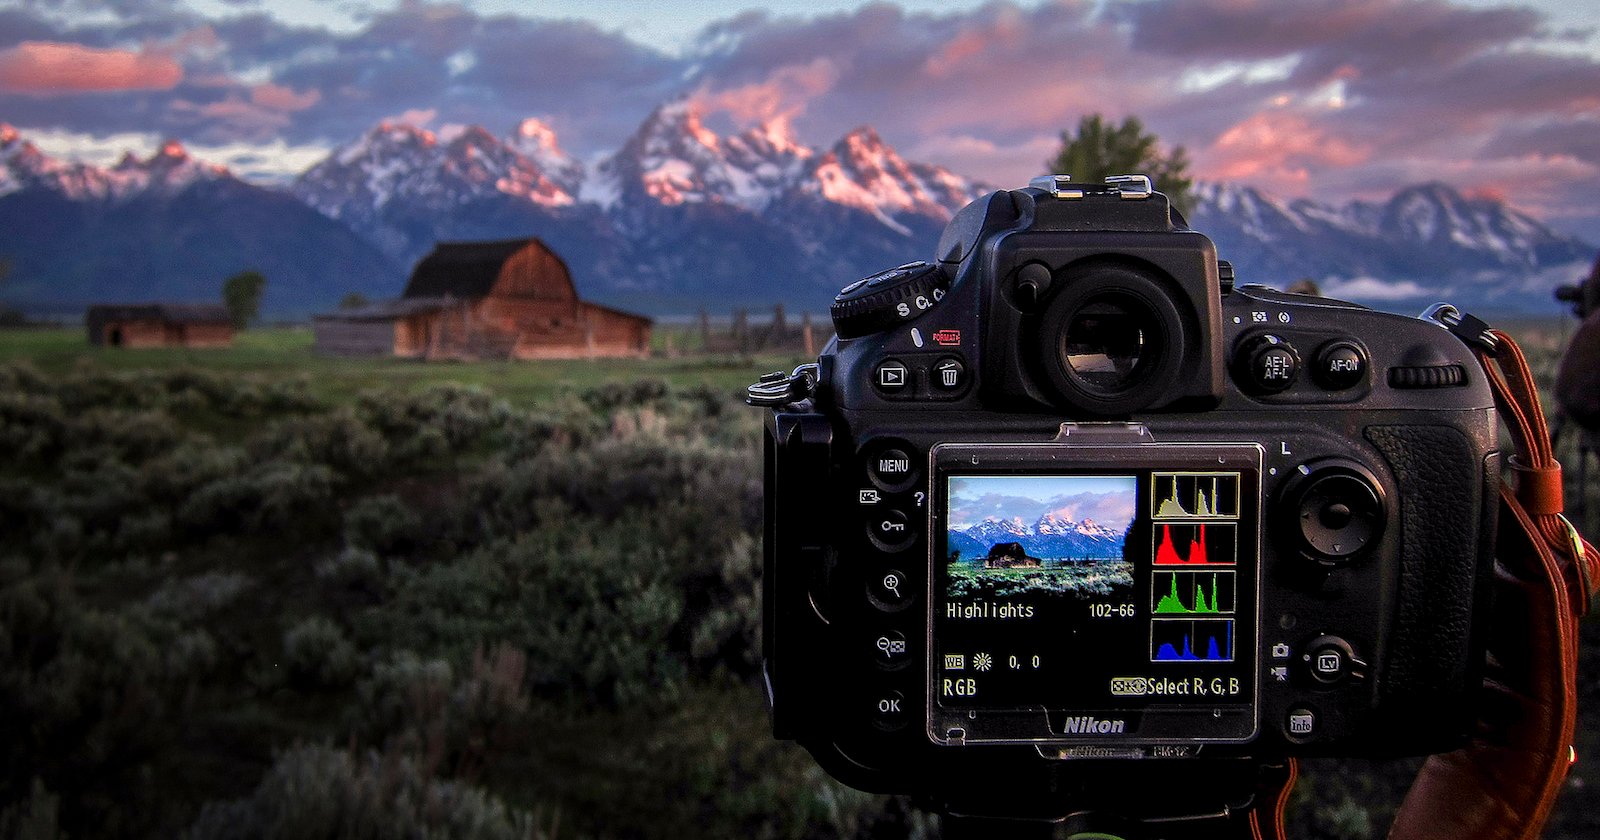
There are two ways to display the histogram and the most important moment when you should check the histogram is right after you took the photo because that is the moment when you can correct the exposure.
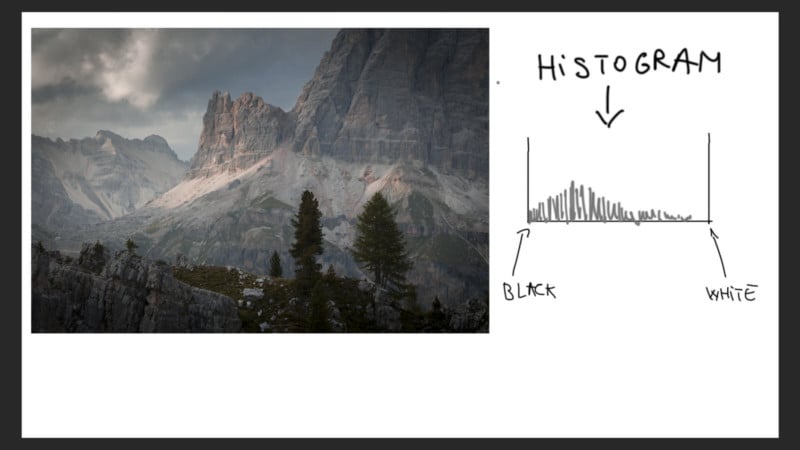
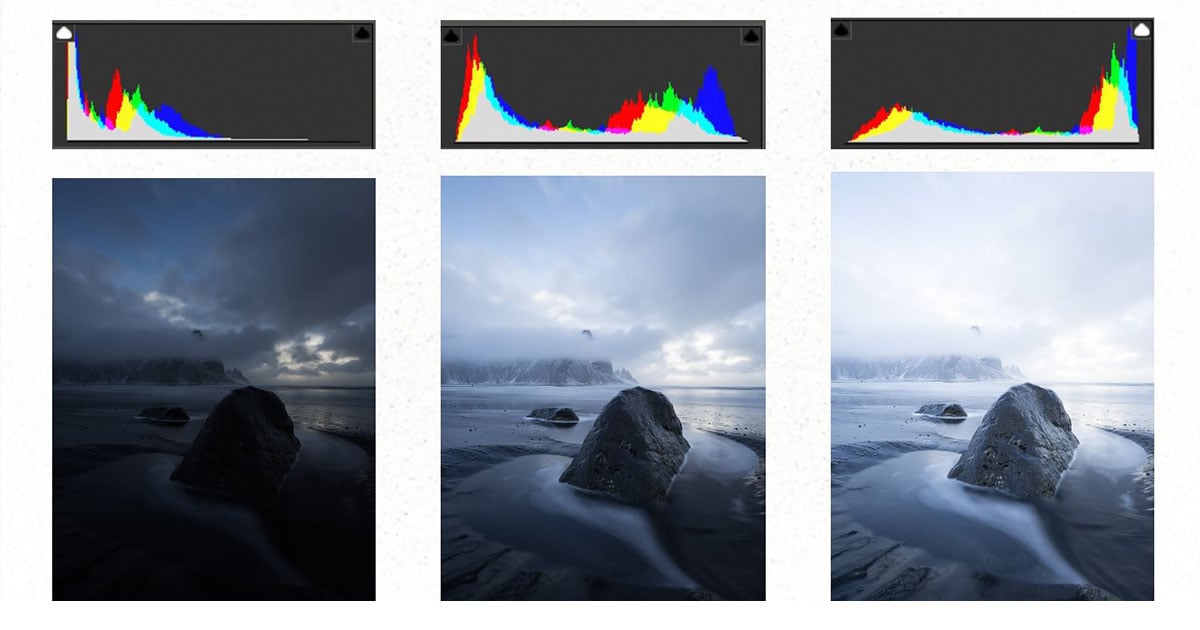
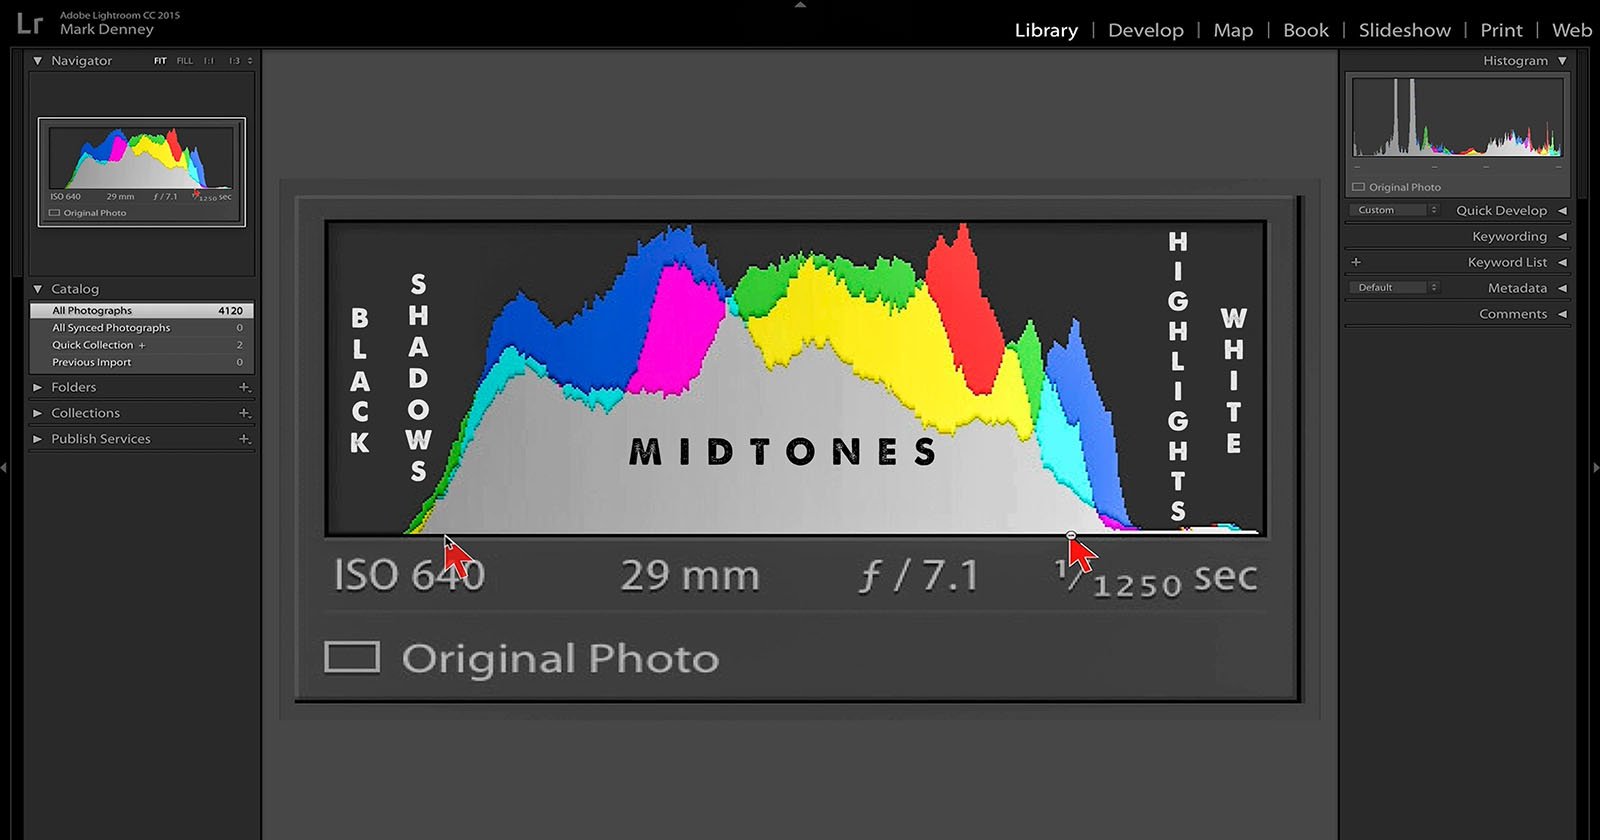
So basically you get a gray graphic that represents the brightness of all the pixels of an image. The graphic starts with black to the left and ends with white to the right. So if you have lots of pixels far to the left side, it means you have some black areas in your photo, and if you have pixels “glued” to the right extremity of the graphic, it means you have blown highlights or areas of white.
There are occasions when you can’t get all the dynamic range of a scene in just one photo. This means that you’ll have either black areas in the image or blown highlights. The solution can be to bracket the scene but sometimes this is not possible: like when shooting landscapes on high wind or when you’re photographing moving subjects like sport. In this case, you need to make a compromise and your decision should be made to support the action or the subject.
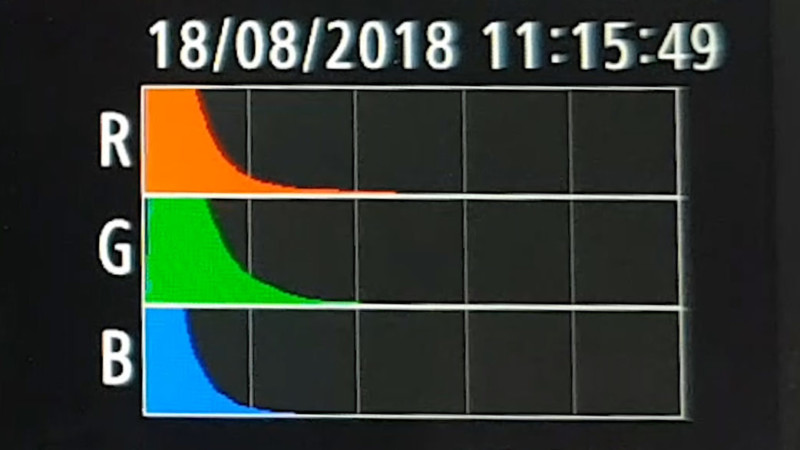
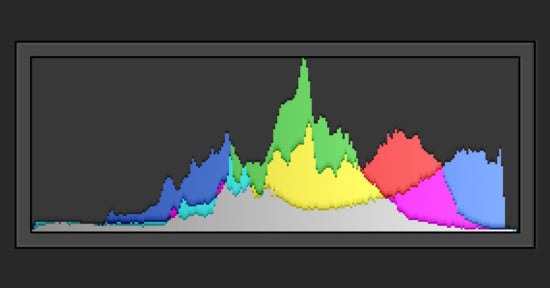
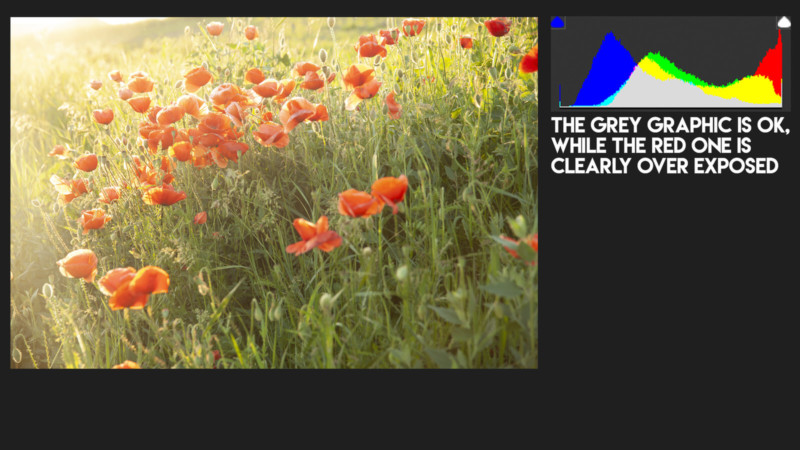
Now let’s talk about the other type of histogram which, in my opinion, is far more important. You see, when you read the histogram and you see all those grey dots, well that’s an average from three other histograms that show the brightness of the pixels but for each color channel individually: red, green and blue. This is more important because if what you see is an average this means you can have one of the channel overexposed, with blown highlights, and you don’t even know it.
How to read a histogram is one of the first things I teach people when I do workshops if they don’t already know how to do it. The reason is because the way the histogram looks dictates how you adjust the exposure in a certain situation. By reading the histogram, you know if the photo is under or overexposed or if the camera captured the entire dynamic range of the scene in front of you.
But keep in mind that the histogram is just a tool. Understanding how to read it will help your photography but will not take artistic decisions for you!
P.S. If you found this video and article helpful, you can follow along with my videos by subscribing to my YouTube channel.
About the author: Toma Bonciu is a landscape and travel photographer. The opinions expressed in this article are solely those of the author. You can find more of Bonciu’s work on his website, YouTube, Instagram, and Facebook.