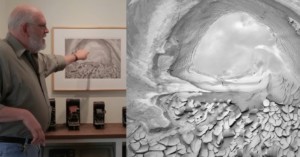
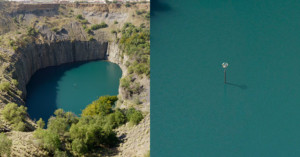
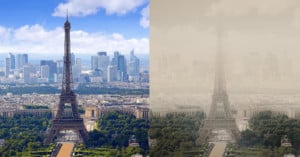
visualization

These Photo Represent the Seven Base Quantities of Physics

The International System of Quantities defines seven base quantities in physics: length, mass, time, electric current, thermodynamic temperature, amount of substance, and luminous intensity. For his project Base Quantities, photographer Greg White set out to shoot 7 photos representing these 7 fundamental quantities.

wikiview is a Powerful Photo Browser for Exploring Wikimedia Commons

Wikimedia Commons has millions of public domain and freely-licensed photos available to the world, and now there's a powerful new tool that helps you dive into the ocean of imagery for exploring or locating exactly what you're looking for. It's called wikiview, and it's a graph-based visual image navigator.

How NASA’s Iconic ‘Earthrise’ Photo Was Shot

"Earthrise" is an iconic photo of Earth rising up from the Moon's horizon that's considered one of the most important environmental photos ever made. Here's a fascinating 3-minute visualization by NASA that recreates how the photo was shot in real-time.

Composition Tips from a Man Who Studied with Ansel Adams

There are only a few people alive as qualified to give photography and composition advice as Huntington Witherill. A former "artist of the year," he studied under the great Ansel Adams and in this video he describes his approach to composing eye-catching images.

This is How Much Diamond is Extracted from Massive Diamond Mines

In the world of diamond mining, huge open pits are dug into the Earth in order to find and extract a relatively small amount of usable diamonds. For his new set of images in his ongoing For What It's Worth project, photographer Dillon Marsh created a series of photos showing this dramatic comparison.

Photo Mosaics That Show Just How Much Internet Reproductions “Lie”

Fernanda ViƩgas and Martin Wattenberg are scientists by trade and artists at heart. They work as the leads of a Google research group in Cambridge, Massachusetts, and are constantly on the lookout for interesting (and artistic) ways to visualize data.

Back in 2011, they came up with an interesting project titled "The Art Of Reproduction," which shows how digital reproductions of photographs (and paintings) found on the Internet are far from "truthful."

Neat Visualizations of the 1 Million+ Pics Shot from Space by NASA Astronauts

Since NASA's first mission to the International Space Station back in 2000, astronauts on board the artificial satellite have snapped over 1.1 million photographs. What's neat is that every one of those photographs is available to the general public through a giant online database.

Open source rocket scientist Nathan Bergey decided to use his coding skills to do a little digging through the image archive, and ended up creating some beautiful visualizations showing where the images were shot in relation to our planet.

Colorful Explosions That Show How Viral Photos Spread on Facebook

Want to see what it looks like for a photo to go viral on Facebook? Check out these visualizations by San Francisco-based studio Stamen Design, which took three of the most shared images on the social networking service -- Marvin the Martian (visualized above), Famous Failures, and Ab Fab London, all shared by George Takei -- and created a visualization using the data from the hundreds of thousands of shares.

How to Visualize Photography Lighting Setups in Blender

Not too long ago I finally got around to picking up a decent manual flash for exploring lighting and speedlight techniques. I picked up a Yongnuo YN-560 Speedlight Flash for Canon and Nikon, and my friend Sean was kind enough to send me his old radio triggers to play with. I was mostly all set to start exploring the world of off-camera lighting...

Amazing Visualization Showing a Year of Photos Around the World

The folks over at Triposo wanted to know when people around the world take pictures, so they harvested the timestamps and geolocation data from photos shared on the Internet and created this beautiful visualization showing one year of photos taken around the world (be sure to watch it full screen and in HD). It's neat seeing certain parts of the world light up with photo activity on special days.

Generate an Infographic Showing Your iPhone Photo Habits

Photo Stats is a new iPhone app that can help you visualize your iPhoneography habits by automatically generating interesting infographics showing things such as where you snapped photos and the time of day you shoot the most. You can buy it for $1 in the App Store.

Big City Heat Maps of Local and Tourist Photo Spots

Two weeks ago we posted on the Geotaggers' World Atlas, a project by Eric Fischer that shows heat maps of where photographs are taken in big cities, created using geolocation data from Flickr and Picasa photos.

Fischer now has a new set of maps called Locals and Tourists that distinguish between photos taken by inhabitants of the city and others who are simply passing through.

Some people interpreted the Geotaggers' World Atlas maps to be maps of tourism. This set is an attempt to figure out if that is really true. Some cities (for example Las Vegas and Venice) do seem to be photographed almost entirely by tourists. Others seem to have many pictures taken in piaces that tourists don't visit.

Blue points are locals (determined by whether the person has a history of photographing in that city), red points are tourists, and yellow points indicate photos for which it cannot be determined.

San Francisco

Crowdsourcing Virtual Photo Worlds

In the future, we might be able to roam around a 3D virtual representation of our world, where everything you see was automatically generated from photographs taken at the real locations.

Vision researchers at the University of Washington and Cornell University have been working on turning photographs of things in the real world into 3-dimensional representations. This research could eventually turn snapshots into virtual buildings, neighborhoods, and possibly cities.